In addition to its primary function in retrieving, displaying and exporting TerraServer imagery like USGS topo maps and aerial imagery, USAPhotoMaps has some handy additional capabilities. I’ll talk about the GPS functions in another post, but here are some other useful functions available in USAPhotoMaps:
– Display coordinates in latitude/longitude (decimal or d/m/s), UTM or US National Grid
– Overlay a UTM grid on the display
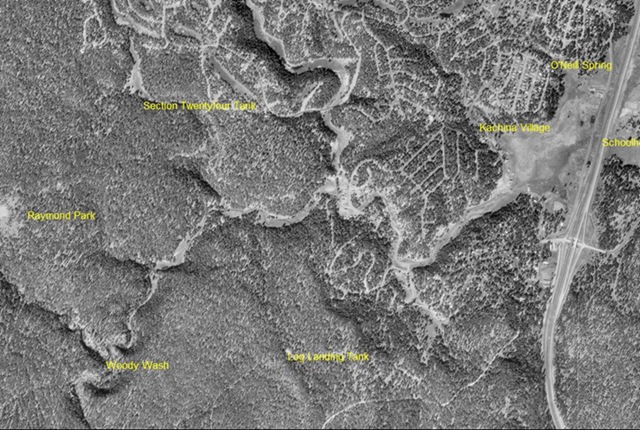
– Press “L”, and USGS landmarks from the gazetteer will be labeled on the image in yellow
– Elevation data can be plotted as contours, and displayed numerically in the status bar, by downloading and processing the elevation data for the area you’re viewing; here’s the helpfile section for that procedure:
“To get elevation data, go to:
http://seamless.usgs.gov/
Click on View & Download United States Data.
After the Viewer opens, you’ll need to click on the Download button on the right and select Elevation and select 1″ NED (1 arc second = approx. 30 meters/data point).
You’ll also need to select Define Download Area by Template Selection (in the Downloads section on the left), and then select 7.5 Minute Grid Cells – CONUS as the Template.
Now you can click on a 7.5 Minute Data Grid Cell that you want to download.
(the orange grid lines on USAPhotoMaps outline the same areas as the Data Grid Cells)
The Request Summary Page will open.
Click on Modify Data Request.
The Request Options Page will open.
Go to near the bottom of it, and at the line (which should be checked) that says National Elevation Dataset (NED) 1 Arc Second, change the selection that says ArcGRID to BIL.
Then select Save Changes & Return to Summary.
On the Request Summary Page, select Download.
After the zipped data file been downloaded to your computer, open it (unzipping is unnecessary) and copy the .bil, .hdr, and .blw files to the USAPhotoMaps folder.
Back in USAPhotoMaps, select File -Elevation -Import Elevation Data.”
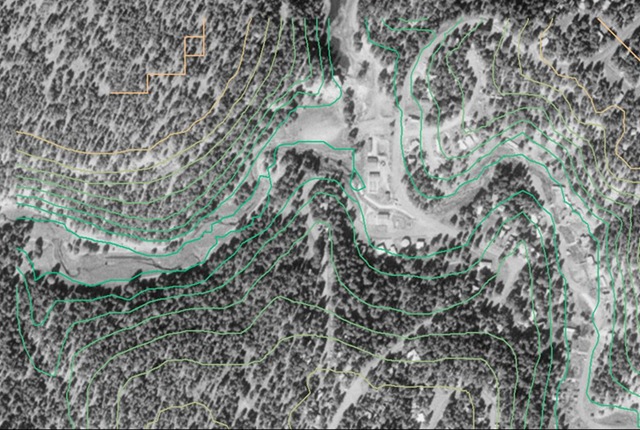
Once you have elevation data for an area, contour lines in that area can be toggled on and off by pressing the C key (between Zoom levels 1 and 8). They’re 20*zoom feet apart (e.g. 160 feet apart at 8 meters/pixel). The lowest elevation contour lines on the screen are green, and the color is graduated to the highest elevation contour lines, which are tan-colored. The contour lines get less accurate as you zoom out.”
– Move the cursor to a point, depress the Ctrl key, then move the cursor to another point; USAPhotoMaps will draw a line between the two, and give you the distance and bearing from the first point to the second. Press Esc to remove the line.
– Press the “X” key, and the cursor’s position will be displayed in a separate box; you can select and copy the position data to paste it elsewhere.
– Move the cursor to a location, press and hold the Shift key, then move the cursor to draw a white screen on the screen. This line will define the orientation of notation text you can enter, and which is saved for future use (see the helpfile for more info).
– Select Help => Get Date of Photo/Topo, and the Terraserver web page for that image will be opened, showing you the date of both the topo image and the aerial imagery.
– Press the “S” key, and USAPhotoMaps will download and convert the current US Census TIGER road map data for the county the current on-screen location is in. Once the data is downloaded and converted (and that only has to be done once for any county), you can plot TIGER road data on the screen using the View => Tiger Streets menu option:
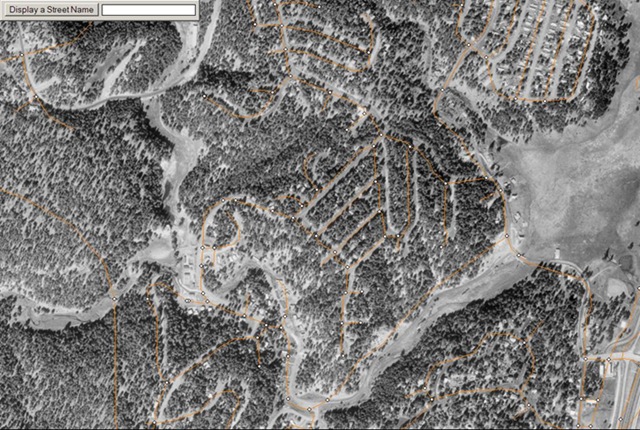
Move the cursor to a TIGER intersection node (the white dots above), and the street names at that intersection will be displayed. You can also type a screen name into the box at the upper right, and have it displayed on the map.