In earlier posts on MicroDEM, the digital elevation model (DEM) has been displayed in reflectance mode, terrain illuminated by light coming from an angle. But it’s also possible to display the elevations as different colors for use as a background image for maps, or for shading.
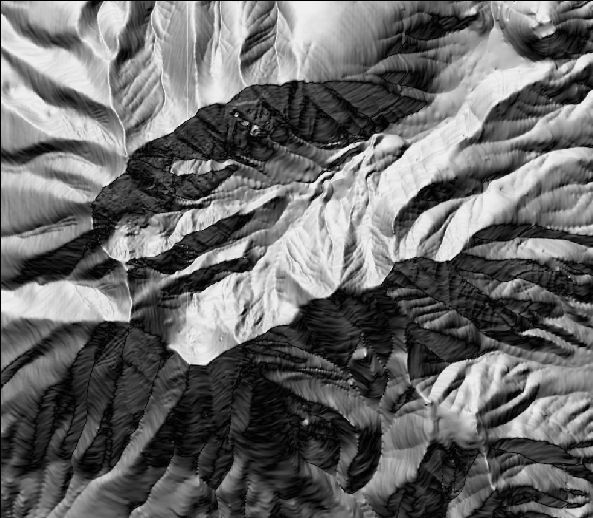
Here’s a reflectance view of terrain in MicroDEM:
If I right-click on the map, select “Display parameter”, then elevation, I get the following window:
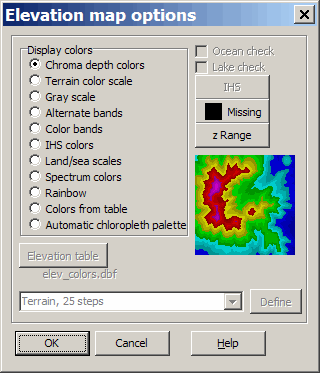
Here I can choose the coloring scheme to use in depicting different elevations, with a preview in the lower right. For example, “Chroma depth colors” gives me this image:
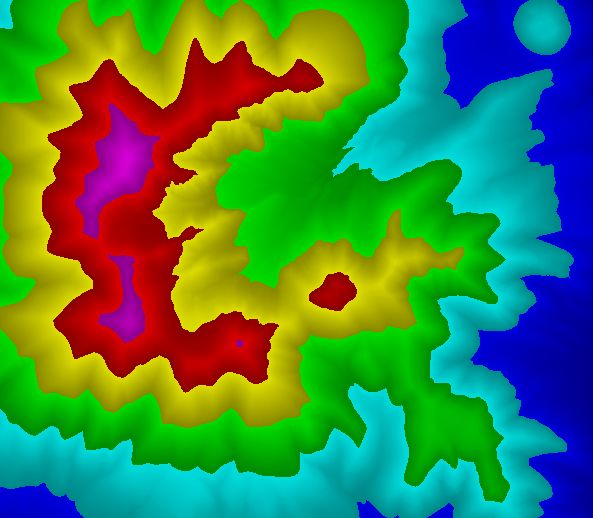
The z Range button lets you set the overall range that the colors will cover.
The first five “Display colors” are presets that you can’t modify. With “IHS colors”, the IHS button becomes active, so that you can modify the intensity, hue and saturation. “Colors from table” brings up an editable table with elevations and RGB intensities that you can modify and save; “Automatic chloropleth palette” lets you define your own palette or choose presets from the drop-down menu at the bottom, like this one for “Terrain 45 steps”:
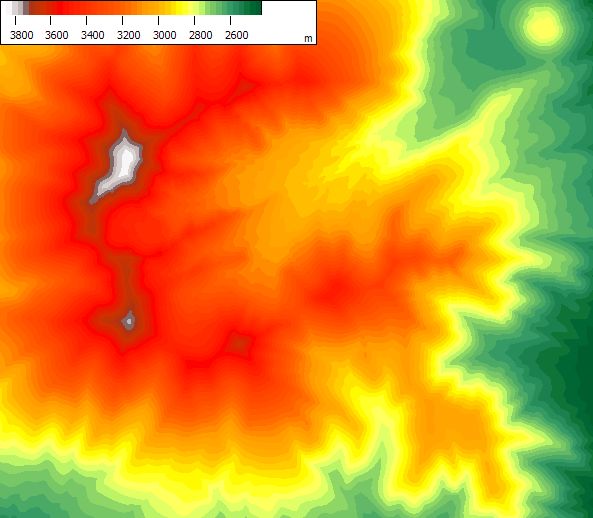
If you select a set of colors, then want to choose a different set, you don’t have to choose “Display parameter” again; just right-click on the map and select “Elevation colors”.’
You can also combine this color scheme with reflectance. Right-click on the map, choose “Map shading options”, choose “Reflectance” or “Terrain shading” , and click OK to convert the image above to this:
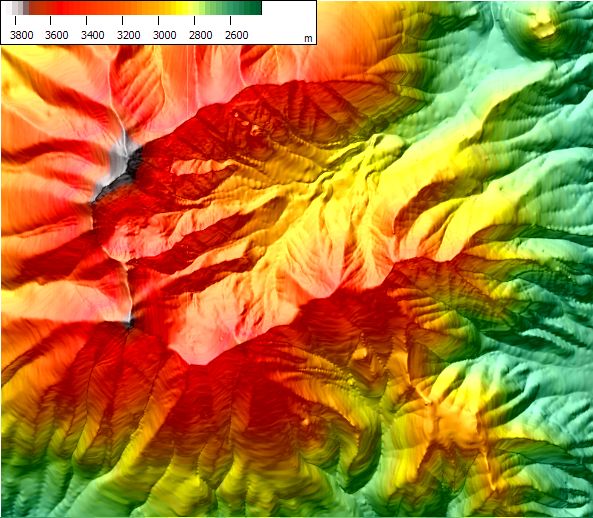
To remove the reflectance shading, go back to “Map shading options” and select “None” from the options. While 3DEM may be a better choice in many cases for this kind of colored terrain shading, MicroDEM is better at plain elevation coloring, and lets you save more custom color sets than 3DEM.
Finally, if you right-click, choose “Display parameters”, then “Contour”, you can create a contour map of the DEM. The Contour options window lets you set the contour interval, colors, font for labels, even export the contours as a shapefile. In these shapefiles, the contours will be made up of line segments, not continuous lines; I’ll cover better options for contour line shapefiles in some future posts. You can export a georeferenced raster image of the contours:
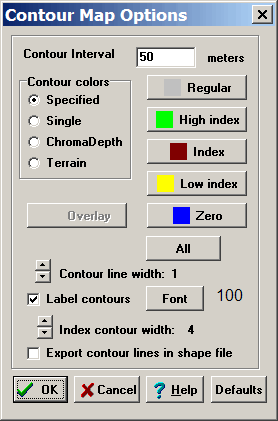
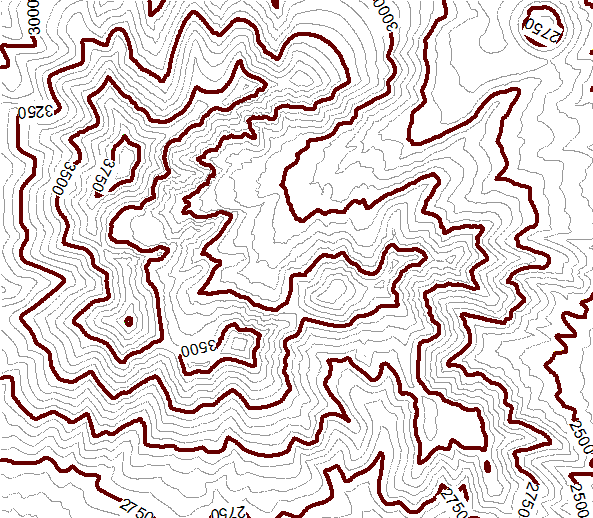
With these defaults, the DEM above becomes this contour map:
Add some grid lines (right-click and choose Grid), a scale ar (right-click and choose Legends/marginalia), shade the map as above, and voila, instant shaded topo map:
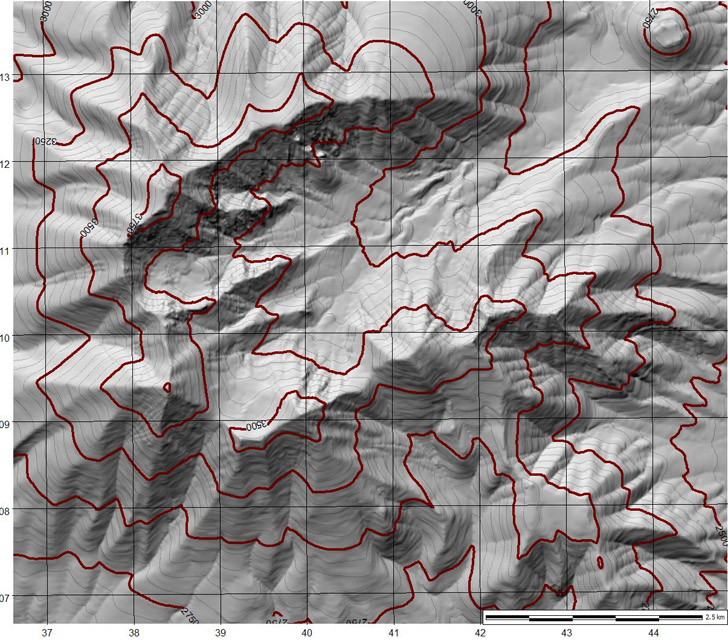
You can export this image into a GIS program, and overlay road and other features to add additional detail.
thanks foe the info