Animated viewsheds – how cool is that?! In an earlier post, I covered how to create basic line-of-sight and viewshed plots in MicroDEM i.e. what you can see from a specific point. But MicroDEM also has some advanced viewshed features that allow you to determine what fraction of a defined area is visible from a specific point, and also the visible terrain not just from a single point but along a route. And the route observations can be converted into an animated representation of the visible terrain from every spot on the route.
Suppose you have a defined “target” area, and you want to know which parts of that area, if any, are visible from a specific point. You can do this on a DEM of the area with Calculate => Intervisibility => Target Coverage function in MicroDEM. First define the target area by double-clicking on the DEM to define the perimeter of the area, right-clicking and selecting “Close polyline” when done to complete the perimeter. In the default “Point digitizing” mode, double-clicking defines points on the perimeter that will be connected by a straight-line. By right-clicking and choosing “Stream digitizing”, clicking and drawing on the map creates a line of arbitrary shape, which is closed into a polygon when you release the mouse button. After defining the target area, double-click on the map to specify the viewer’s position, and you will get the Viewshed Parameters window explained in a previous post. Once done with that, MicroDEM will draw the viewshed from the observer’s position, show how much of it covers the target area, and also tell you what the coverage percentages are:
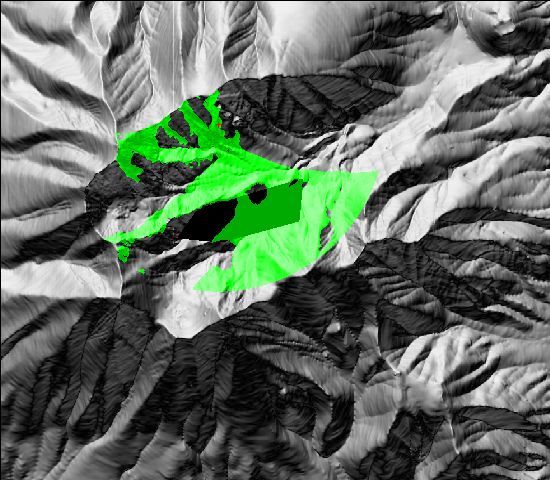
In this picture, the black angular shape in the center is the defined area, the observer’s position is the small red cross on the north side of the bowl, and the green area is the viewshed from that position. Part of the green covers the defined area, and MicroDEM brings up a window saying that 62.46% of the defined area is visible from the observer’s position. Right-click on the map, and choose “Manage Overlays” to remove the viewshed.
Next, suppose you’re traveling through the bowl of these peaks, and you want to see what terrain is visible from every point along the route. Or, conversely, you want to see where you should position yourself to see the greatest possible amount of the route. Choose Calculate => Intervisibility => Route Observation, choose “New route observation”, specify the route you want to travel in point or stream digitizing mode, and enter the viewshed parameters. There’s a new section now in the lower left with additional parameters you can set.
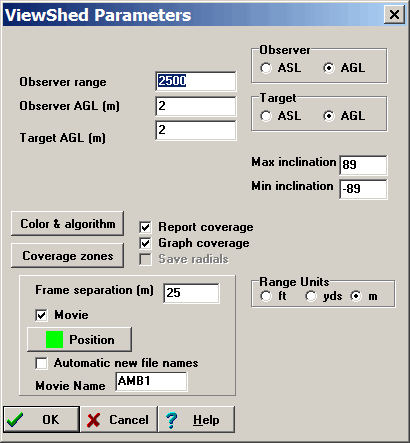
Checking “Movie” will create an animated version of the viewshed as you travel along the route. “Frame separation” is the distance between points where a viewshed is calculated. “Position” lets you set the color that marks the position on the route. “Automatic new file names” keeps the program from overwriting earlier runs.
Clicking on OK will start the process, which may take a while depending on how long the route is, what the frame separation is, and how large the observer range is. Once done, there are two product plots, plus a movie if the box was checked. The first plot shows which areas were able to see any part of the route, with red signifying maximum coverage, purple minimum coverage, and white no coverage:
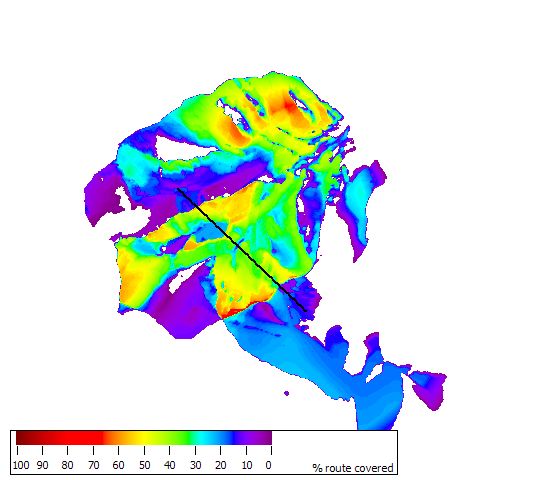
Moving the cursor over this plot, you will see a corresponding cursor on the original map, and also see the coordinates on the bottom status bar. If you wanted to observe as much of the route as possible, you would position yourself in one of the red areas; and if you didn’t want to be seen at all by anyone traveling along that route, you would put yourself in the white area.
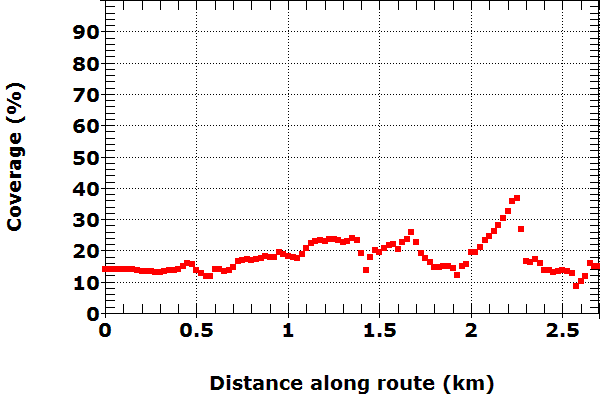
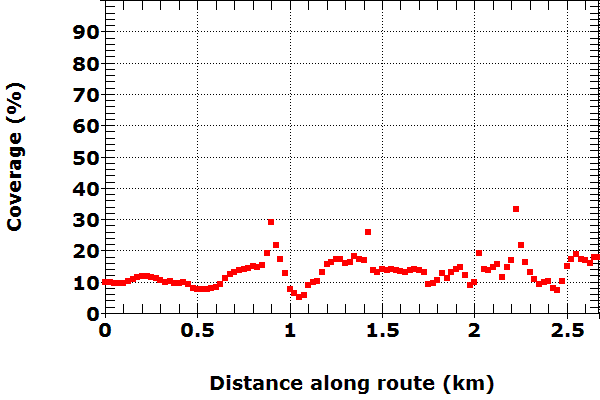
The second plot shows the percentage of the total terrain within the traveler’s observation range that is visible along every part of the route:
If you checked the “Movie” box, it will open automatically in a built-in movie player:
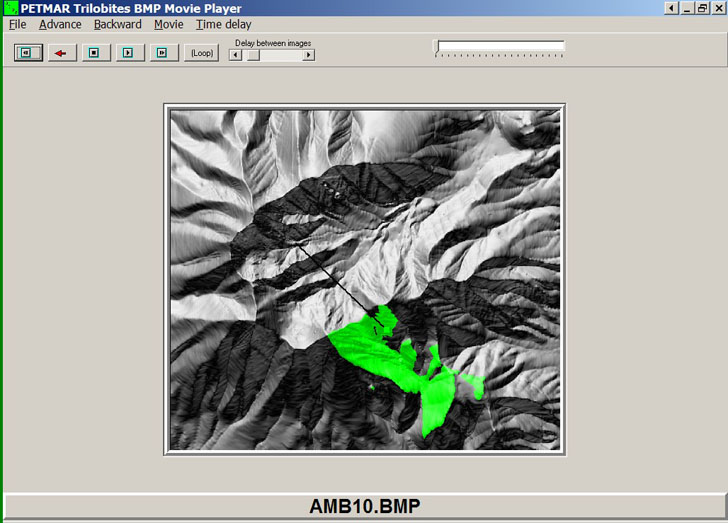
There are buttons and menus at the top to control the movie playback. You can also save the movie as an animated GIF, AVI, or MPEG file, adding titles and logo as well. Here’s the animated movie for the above:
And here’s another animated movie showing that you’re not just limited to a straight line:
Finally, you can also combine target coverage with route observation to create plots and a movie that show how much of a defined target area is visible from every location. This time, you will get a plot showing what percentage of the target area is visible from every point on the route:
A movie will be produced as well if the box was checked.