Although you view a DEM (digital elevation model) as a two-dimensional representation of terrain in MicroDEM, the program can treat it as a 3-dimensional surface and analyze it as such. Perhaps the simplest example of this is in answering the question, “What terrain can you see when you’re standing at a specific location?”, and MicroDEM has tools that let you do that.
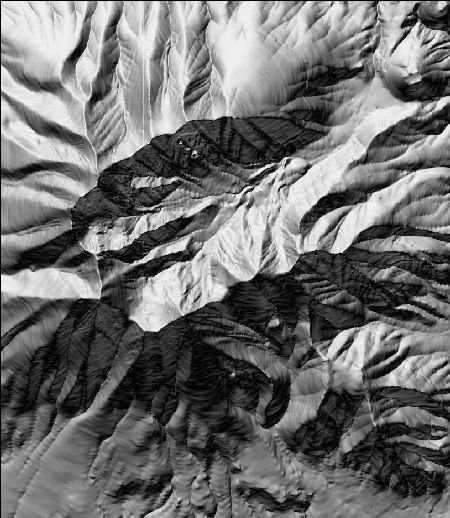
Here’s a DEM loaded into MicroDEM in reflectance mode, showing the San Francisco Peaks near Flagstaff, Arizona:
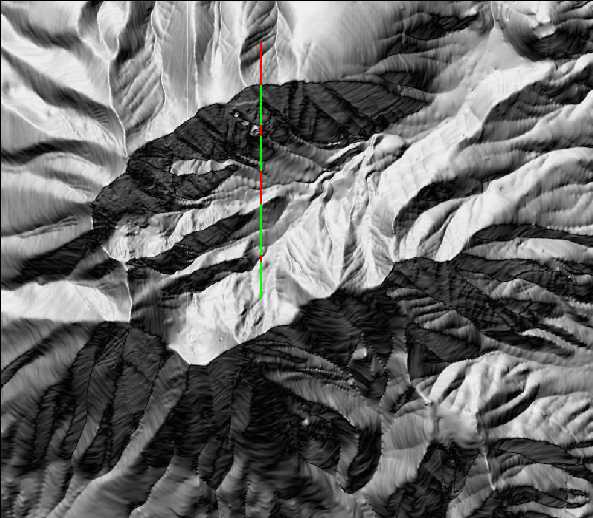
Suppose I’m standing at a point on the southern side of the interior bowl of the peaks, and want to know what terrain features are visible when I look due north. Selecting View => LOS from the menu, or clicking on the LOS button on the main toolbar, puts me in Line-Of-Sight mode. Double-clicking on the terrain sets the ground position I’m viewing from; double-clicking on a point north of my position sets the point I’m looking towards. The program then plots a line across the terrain, with green representing areas that I can see from my current position, and red representing areas that aren’t visible:
MicroDEM also produces a graph that shows the terrain profile between the two points you clicked on, with the visible sections marked in green and the hidden sections in red:
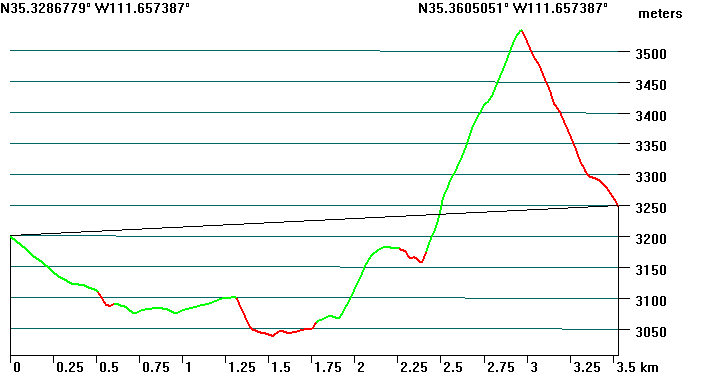
Click and drag on an edge of the graph to re-size it; right-clicking gives you additional options. For example, if you right-click and select “Measure slope”, you can select any two points on the line by double-clicking, and measure the slope between them. If you move your cursor across the graph, a crosshair will appear on the terrain indicating which position that corresponds to.
To remove the line on the terrain map, click on the “Force redraw” button on the map toolbar:

Now imagine repeating that line-of-sight process over and over again at every angle; the resulting image would show you what fraction of all the terrain was visible from your location. Such an image is called a “viewshed”; MicroDEM reveals its military heritage by sometimes referring to it as a “weapons fan”. To create a viewshed image, click on the “weapons fan” button on the map toolbar:

Then double-click on the location you’ll be viewing from on the map. The Viewshed Parameters window will open up:
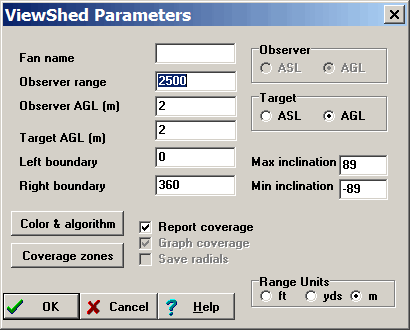
Here you set:
- Fan Name: A name the fan is saved under, so you can keep track of it as an overlay. You can leave this blank if you want.
- Observer range: How far out the viewshed will be calculated
- Observer AGL: The height of the observer’s eyes Above Ground Level
- Target AGL: How far Above Ground Level objects have to be in order to be seen
- Left,right boundary: Angular limits of the viewshed (0/360=North, 90=East, etc.)
- Target: ASL is above sea level, AGL is above ground level; AGL will be the usual choice
- Max/min inclination: Inclination up and down (in degrees) you can look from your current location
- Report coverage: Will show a text box with information about what percentage of the total area defined by the observer range you can see from that location
- Range units: Sets the units for all the distances
The “Color & Algorithm” button options up another options window:
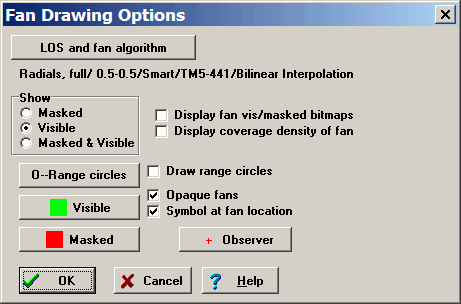
Here you set whether you want the terrain visible from the location to be marked on the map, the masked terrain, or both; the colors for visible and masked terrain; and whether you want a symbol at the observer location or not, with the option to select the symbol by clicking on the “Observer” button. “Opaque fans” doesn’t currently have much effect; “Draw range circles” will work if checked as long as you’ve set the range circle distances by clicking on the “0-Range circles” button. The two “Display” checkboxes create non-georeferenced stand-alone images of the fans and associated data, which I find of limited use.
With the default settings for both the Viewshed Parameters and the Fan Drawing Options, I get the following:
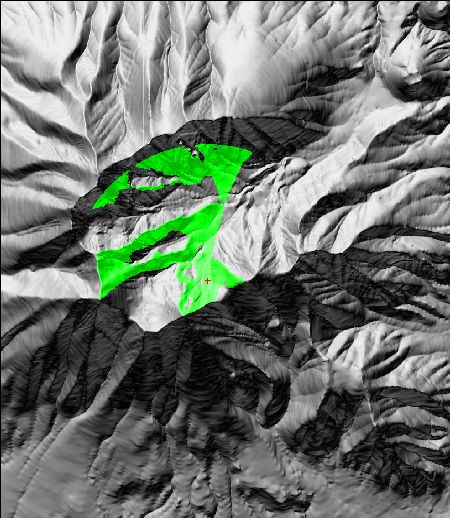
The green areas mark the terrain visible from the observer’s location, marked with a red cross. A text window tells me that 17.41% of the total area with a radius of 2500 meters around the observer is visible. To remove the viewshed, right-click on the map, select “Manage Overlays”, and remove the single overlay.
What if I want to put that viewshed on a map, instead of on the image of the terrain? If you load a georeferenced map that covers the same area as the DEM, say a topo map, MicroDEM associates the map with the terrain so that you can perform the same LOS and viewshed operation on the topo map to get a similar display. Using File => Open Scanned Map, I can open up a map that covers the same area as the DEM, and plot a viewshed directly on top of it, this time plotting both the visible (green) and masked (red) areas on it:
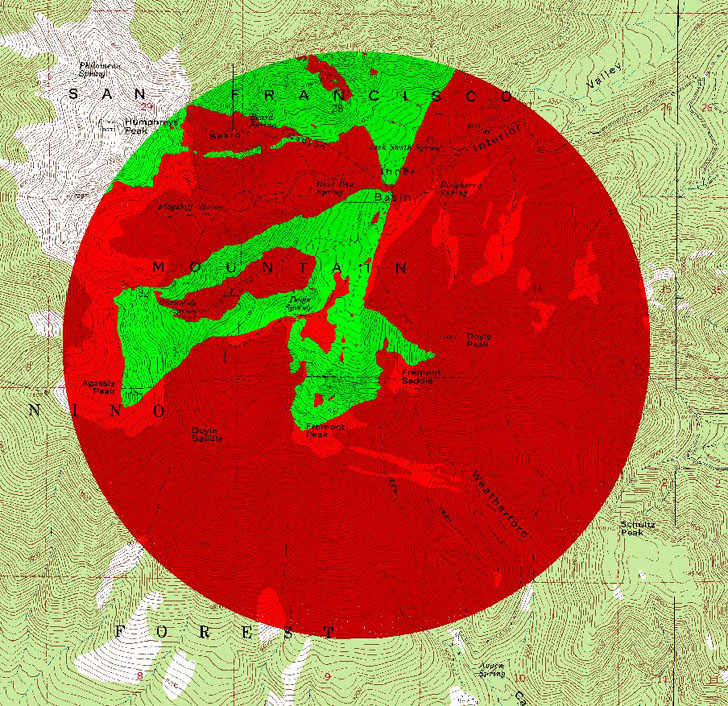
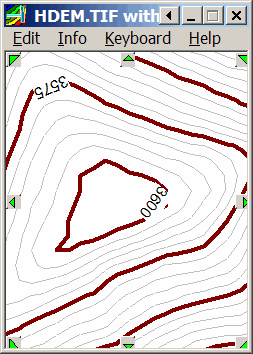
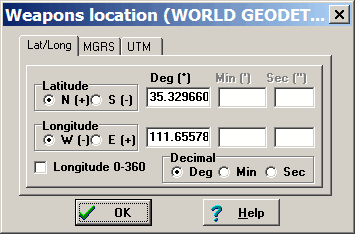
This second weapons fan looks slightly different than the first one above, and not just because I’ve zoomed in a bit. That’s because I placed the observer’s position by double-clicking on the map, which is hard to do accurately and repeatably. But you can set the observer’s position more precisely than that by changing some settings in the Options menu. Click on the Coordinates tab, and under “Verify Graphical Selections” you’ll have three choices: None (double-click always sets the position), Reasonable (sometimes double-click sets the position, other times you can be more specific), and All (you will always have to specify the position more precisely). Below those choices is “Verify”. “Graphical blowup” displays a blown-up contour map of the location you double-click on the map, so that you can select the position more precisely based on topography.
“Keyboard entry” brings up a window when you double-click on terrain that lets you enter the exact coordinates:
Now suppose I want to export the viewshed alone, without an underlying terrain or topo map, for use in another GIS program as either as a raster image or as a polygon shapefile. Exporting it as a usable raster image is easy, but creating a polygon shapefile out of it takes a bit more work. Both will be covered in upcoming posts.
Software looks awesome. Where can I get recent central Arkansas DEM data?
You can get DEM data from the USGS Seamless Server at 10-meter resolution.