blankblank blank


Archive Page 6 of 106


Useful ArcGIS Explorer Add-Ins III

One final set of add-ins for the excellent GIS data viewer ArcGIS Explorer, discovered by searching the site (since there doesn’t seem to be a gallery/catalog section for these on the site). Here’s the link to Part I, and here’s Part II.

Table Viewer – Supposedly adds the ability to view tabular database data, a feature sorely missing from the default installation. But I tried to figure out how to open a shapefile’s DBF table (supposedly supported by this option) without success; maybe you’ll have better luck. Also supposedly supports online geodatabases.

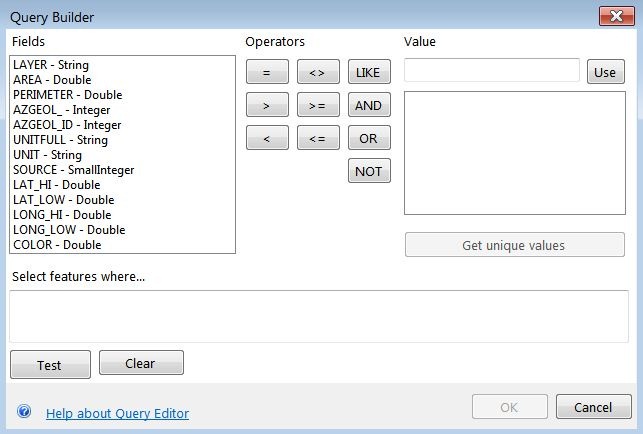
Query FeaturesExplorer has a built-in Query function (available on the Tools tab) that creates a classic SQL query, and then highlights all matching features in the map view:

query1

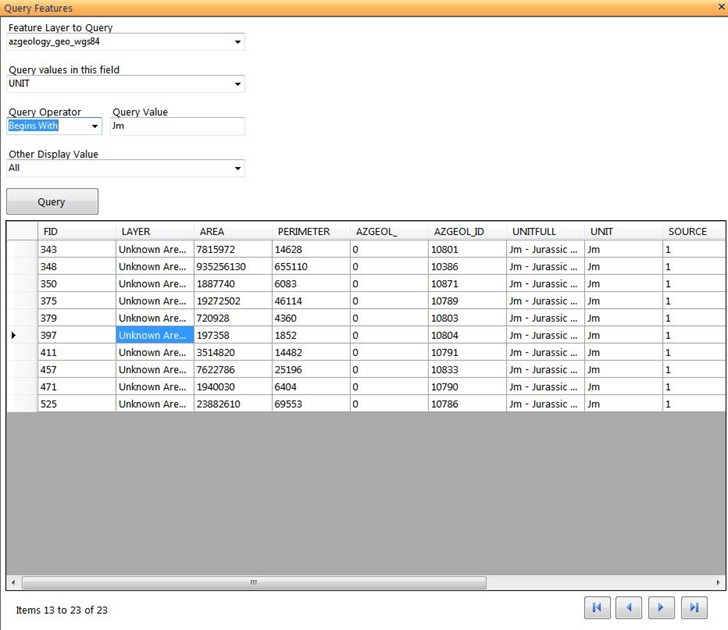
The Query Features add-in works somewhat differently – it creates a tabular view of matching features, and then clicking on a table entry zooms you in to that single feature on the map:

query2

You can use both query functions at the same time, and they complement each other quite well.

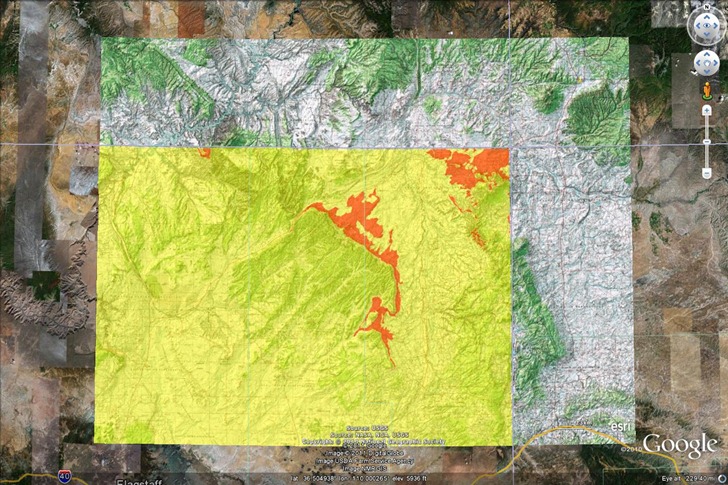
AGX2KML – Takes the current map view, and converts it into a KMZ image overlay file for use in Google Earth. Here’s a queried selection for the Jurassic Morrison format in Arizona, viewed in Explorer and then converted to a KMZ overlay:

agx2kml

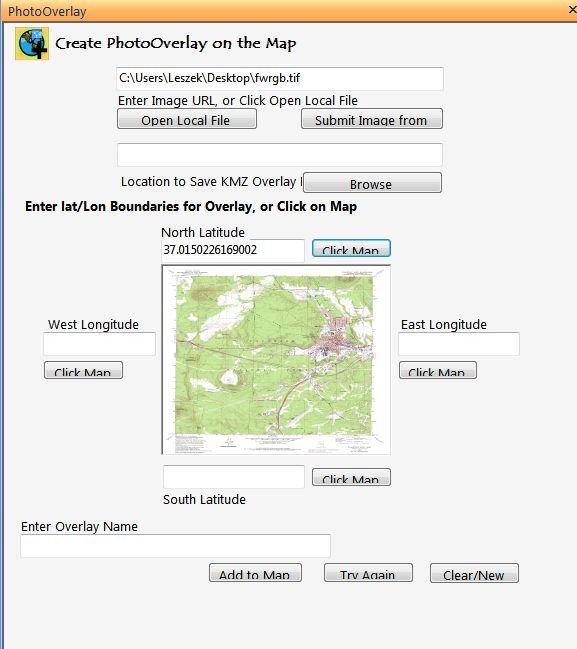
PhotoOverlay – Lets you create a KMZ overlay from an input image. Bit clunky to use, as it requires you to enter the N/S latitude and E/W longitude limits for the image manually, or by clicking on the map; would work better if you could georeference any points on the map image to points in Explorer; as is, you’d probably be better off loading the image directly into Google Earth and manually calibrating the image.

po

PhotoPoint – A utility to simplify (somewhat) the adding of picture data to a map. In the main add-in input window, you specify the picture (either URL or local file), and add additional descriptive data; you can specify coordinates by clicking on the map, or typing them into the box.

pp

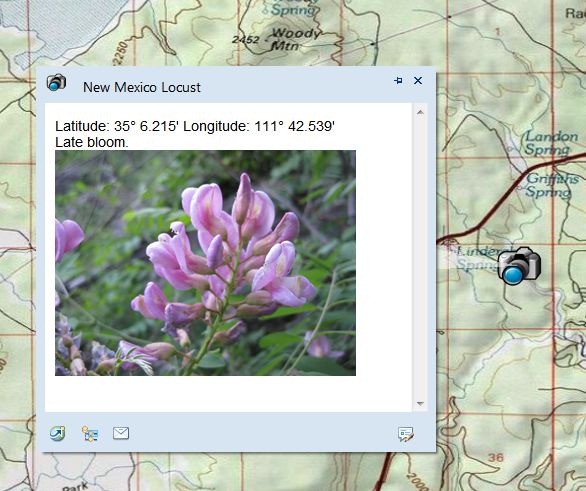
This utility does not recognize embedded geotagging data, nor will it embed coordinate data into the photo; it just creates a photo content file on the map, with a pop-up that includes the entered data:

pp_popup

If you want to geotag images, or use geotagged photos, the Image Geotagger add-in (described here) might be a better choice; no popup text data entry options, but it will use embedded geotagging data to place the photo.

Finally, there are some expansion packs that add additional capabilities to ArcGIS Explorer; links to the downloads can be found on the main ArcGIS Explorer Desktop download page.

Projection Engine Expansion Pack – The default install of ArcGIS Explorer Desktop comes with geographic coordinates as the default (lat/long/WGS84); in the Display section, you can select MGRS or USNG grid directly from the Coordinates dropdown, or choose “More” to get a full list of available coordinate systems. The Projection Engine Pack adds some more coordinate systems to this “More” section.

Fonts Expansion PackLike it says, makes more font choices available for labels.

Data Access Expansion Pack – “Expands geodatabase functionality by allowing direct connections to multi-user geodatabases.” No personal experience with this.


Useful ArcGIS Explorer Desktop Add-Ins II

Continued from Part I yesterday …

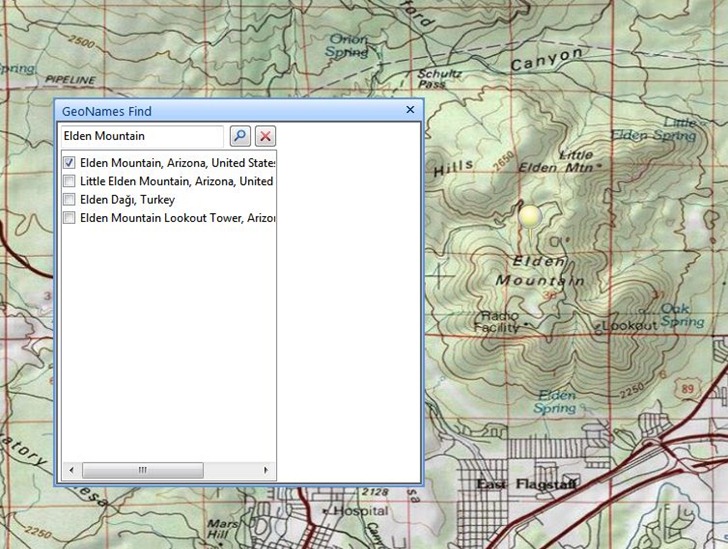
GeoNames Find – Enter the name of a geographic feature, and ArcGIS Explorer will go the best fit for the entered name, as well as offering a full set of options.

geonames_find

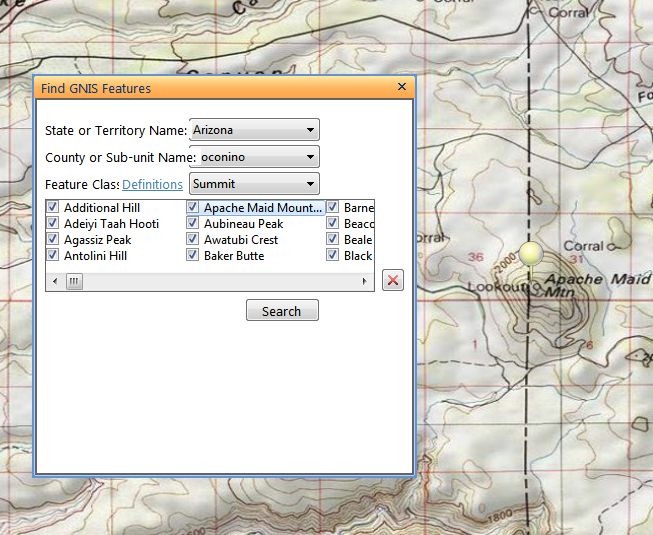
Find GNIS Features – Select a US state/county, and a feature type from the Geographic Names Information System (GNIS), like town, arch, summit, mine, reservoir, etc., and get all such features in that area plotted:

find_gnis_1

Double-click on any of the names listed, and the map will zoom in on the selected feature:

find_gnis_2

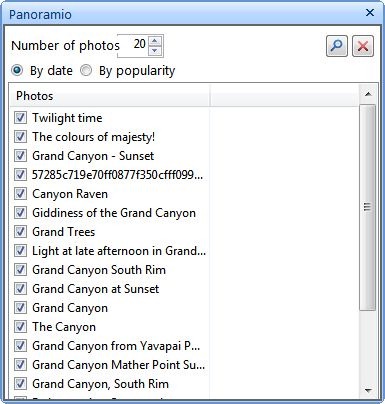
Panoramio – Pan/zoom to your desired area, and get photos from Panoramio:

panoramio

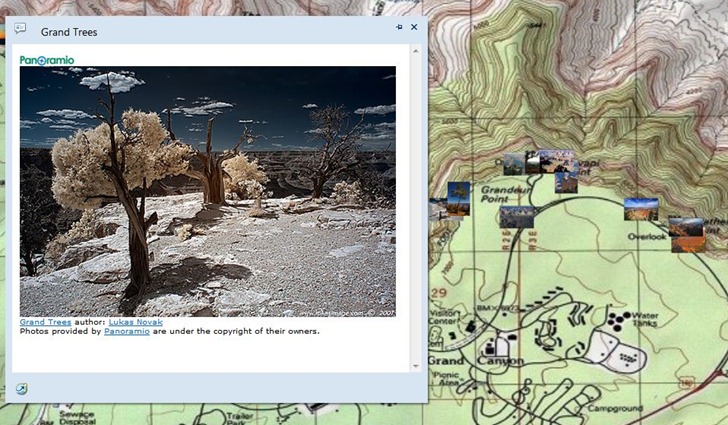
Photo thumbnails will be plotted on the map; double-click on a thumbnail to get a larger-sized image in a pop-up:

p_gc

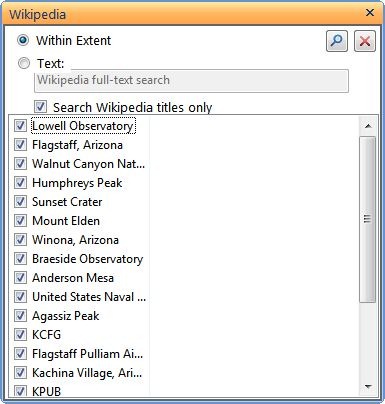
Wikipedia – Same general idea as Panoramio; go to the desired area, and search for Wikipedia entries geotagged to that location (or search by text):

wikipedia

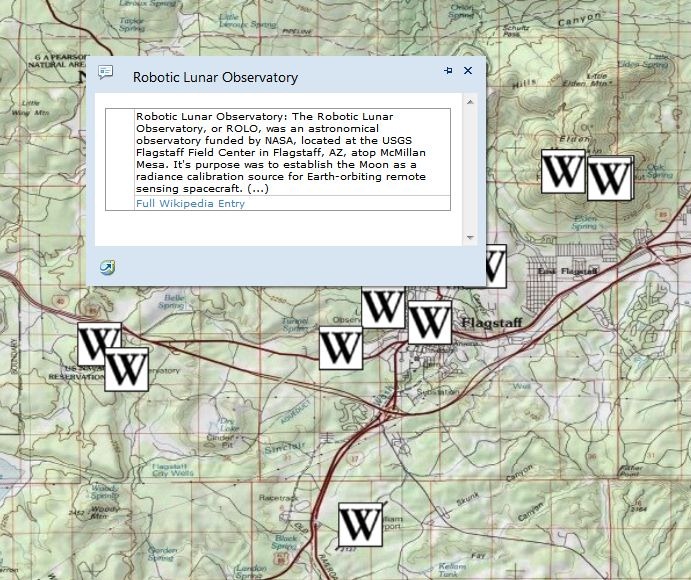
Entries will be plotted on the map; double-click on a “W” icon to get the start of the Wikipedia entry, and a link to go to the full article:

wiki_pop

Set Transparent Color For Image Overlay – Image overlays are graphics that sit at a constant spot in the view; examples might be a logo graphic or map legend. This add-in lets you set a transparent color, useful if you have a logo/legend on a white background, and you want the background to disappear. Unlike the map transparency feature, this will work with graphics with indexed colors (TIFFs, GIF, PNG).

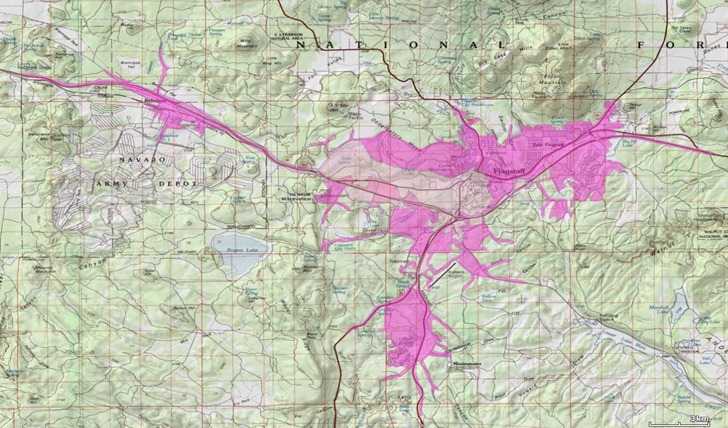
Drive Time Analysis – An interesting example of the kinds of analysis tools that can be created using the ArcGIS Explorer SDK. This add-in calculates areas within a certain driving time of a user-specified starting point (up to 15 minutes driving time in this sample add-in). Below, the lightest color is 5 minutes, next is 10, darkest color is 15 minutes away.

drive_time

Still a few left; I’ll save those for Part III.


Useful ArcGIS Explorer Add-Ins I

Yesterday’s post was about the latest version of ArcGIS Explorer Desktop, ESRI’s digital globe and GIS data viewer. One of its major advantages over Google Earth is the ability to create “add-ins”, user-programmable plug-ins that add functionality. But there doesn’t seem to be a catalog/gallery of these add-ins at the ArcGIS site. Searching around, I found a bunch of potentially useful ones. Install them by downloading the “eaz” file, then go to the Display ribbong, Options section, click on the Resources link, select “Manage Add-Ins”, and choose the downloaded eaz file. Add-ins will show up either on the Add-Ins ribbon, or in some cases in the Analysis section of the Home ribbon.

Garmin Tools – Converts an ArcGIS display into a KMZ overlay file compatible with newer Garmin units; there was a post on this tool a while back on this site.

Georeferencing – Import a raster image, and then georeference it using a three-point affine transformation. Works well with Mercator-based map projections. Limited support for some raster formats (e.g. doesn’t work with indexed-color TIFF files), and parts of the image can disappear after georeferencing. Finally, you can’t export the georeferenced image, though you can save it as part of the default view in ArcGIS Explorer. Addendum: Whoops – just found a world file and XML file that go with the image file. However, the world file is in geographic coordinates regardless of what the original image’s projection is in; it also includes non-zero rotation parameters, which a fair number of GIS programs can’t handle.

Capture Presentation Slides, Convert Presentation to PPT – Explorer Desktop lets you create presentations from map views. “Capture Presentation Slides” automatically creates a basic presentation by zooming in to every data layer loaded, creating a title from the data name, then generating a slide. “Convert Presentation to PPT” captures the slides as JPGs, then creates a PowerPoint file to display them.

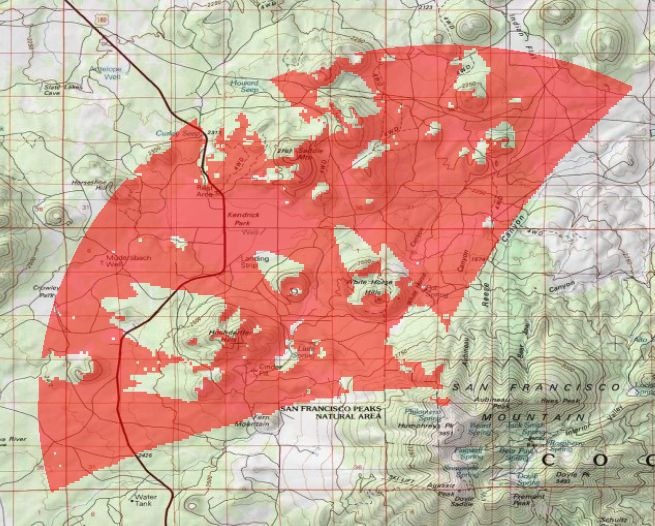
Visibility Analysis – Generate a viewshed from a chosen point using 90m DEM data (maximum distance is 20 km), which is added to the data layers.

viewshed

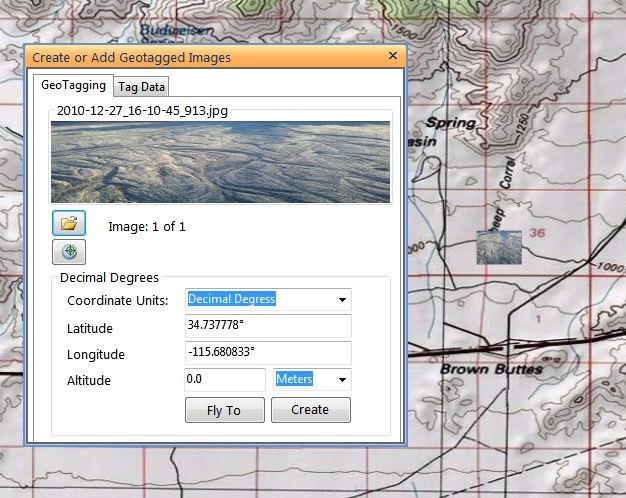
Image Geotagger – Add a previously-geotagged image, or geotag a new image and have it saved under a different name.

geotag1

The image will show as a small thumbnail on the map; click on it to bring up a pop-up window with a full-scale view of the picture.

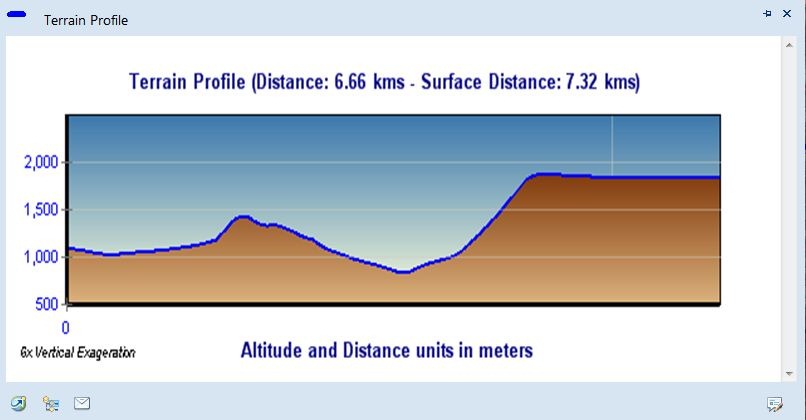
Terrain Profile – Draw a single track line, or series of track line segments, and get an elevation profile along that track.

terrain_profile

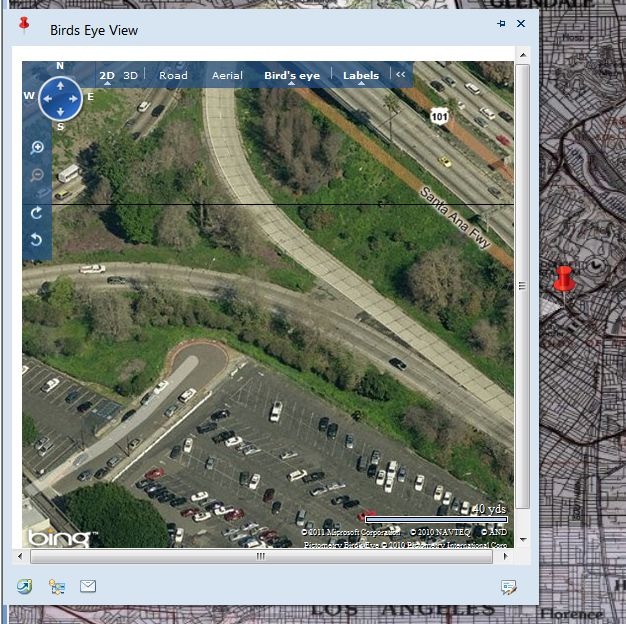
Bing Birds Eye View – Click on the map, and get a pop-up with a Bing Maps window; not just Birds Eye oblique views, but the option for standard Bing Maps as well.

bing

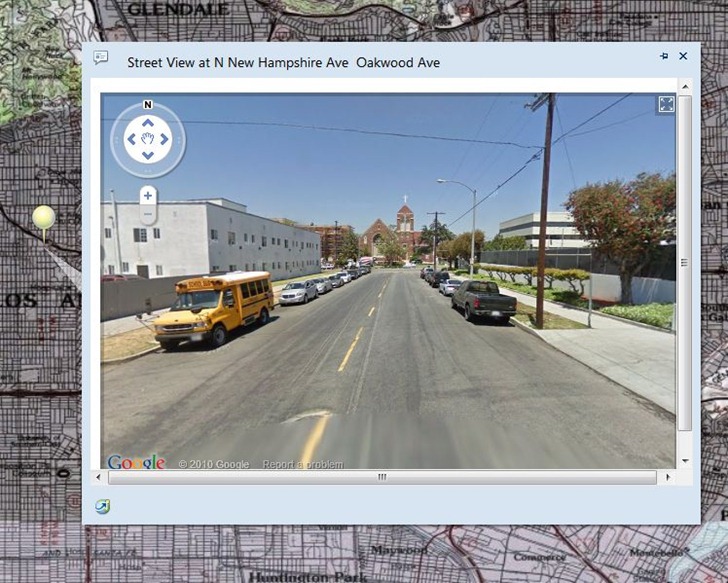
Street Viewer – Similar to the above, but brings up a pop-up window with the Google Street View display (and interactive viewer)

streetview

More tomorrow …


Hey, ArcGIS Explorer Desktop Has Turned Out Pretty Good!

Yeah, that’s not news to a lot of you, but it is to me. My last significant exposure to ESRI’s ArcGIS Explorer digital globe software (Windows only) was back when it came out, quite a few years ago. I tried it, and found it inferior to Google Earth in performance in 3D, and too complicated to bother learning it; since then, I’ve stuck strictly with Google Earth. A recent post on the free Garmin Tool application, which creates Garmin Custom Map overlays using ArcGIS Explorer, forced me to look at it again, and I was surprised to discover that it’s turned into a pretty cool, and pretty useful tool. Not perfect – the 3D performance is still pretty weak compared to Google Earth, and the out-of-the-box configuration isn’t as strong. But it has it’s own very strong set of features, and when used in 2D mode, is a good addition to any geography toolbox. Nice re-organization of tools/features in a MS-Word-like ribbon format, much better than the original interface.

  • A good selection of basemap imagery sets, including Bing Maps (aerial/road/hybrid), general world imagery/topographic/road maps, OSM, general terrain shading and National Geographic shaded topo maps:

natgeo

No vector basemap data, like the roads you’ll find in Google Earth.

  • Add raster/vector data from multiple data sources and types: ArcGIS Online, GIS web services (ArcGIS servers, GeoRSS, WMS), ArcGIS lyr files, shapefiles, KML, GeoDatabases, text files, georeferenced raster imagery (e.g. GeoTiffs), and GPS data files (GPX).
  • Vector editing tools: Point, Line Area, Circle, Rectangle.
  • Export data in KML format (for user-created vector data), nmc map content packages for other ArcGIS Explorer users, or lpk layer files for ArcGIS.
  • Driving directions/routing
  • Add links to non-geographic data (documents, images)
  • Measurement tools for distance/area
  • Create a slide presentation by saving a series of map views
  • Time/flight animations

Oh the “needs work” side:

  • In the default install, I can’t find a way to set shapefile colors/sizes/symbols to depend on attribute values. For example, if you have an area shapefile with multiple subareas, each depicting an area with a separate property, they’re all displayed with the same color. For a GIS data viewer, this is a major missing feature. No selection/filtering by attribute either. The only way to view attribute data is through an on-screen pop-up; no tabular views of the DBF data.
  • I initially thought there was no adjustable transparency for raster/vector layers, but it’s under the Appearance ribbon tab, instead of in the Properties window for each layer, which is where you’d normally expect to find it.
  • Zoom and tilt controls are the opposite of every other digital globe I’ve used; scroll the mouse wheel away from you to zoom in, click the center button and move the mouse away from you to tilt the view to an oblique angle. And boy, can it be unresponsive sometimes in 3D mode! I usually only use the program in 2D mode only, so as not to have to deal with those issues.
  • There’s a nice interface for querying/previewing datasets available in ArcGIS Online, but there’s no comparable gallery of pre-packaged content files (NMC/NMF files) anywhere on the ArcGIS website, at least that I could find.
  • The app comes with the ability to add GIS-like analysis tools, as well as utilities like the Garmin Tool mentioned above (created with .Net and a free SDK kit from ESRI). By default, it comes with a buffer tool only; the process for adding additional tools isn’t explained very clearly in the help file. And while there’s a fair number of tools available, they’re hard to find; there doesn’t seem to be any systematic directory or catalog of them on the ArcGIS site. With some work, I tracked down some of them, and will post on them tomorrow.


How The FCC Plans To Destroy GPS – A Simple Explanation

Cross-posted at the AndroGeoid site.

If anyone had told me three months ago that a company was going to propose a system that would fully disable GPS in areas that cover most of the population of the US, I would have ignored them. If someone told me two months ago that the FCC would give this proposal serious consideration, I would have laughed. If someone had told me a month ago that the US Federal Communications Commission  would actually approve this scheme, I would have considered them crazy. And yet, that’s exactly what’s happened; the FCC has given conditional approval to LightSquared’s 4G LTE proposal (PDF link) . If implemented as planned, all current GPS receivers will no longer operate correctly in areas covered by their system, which include the overwhelming majority of the US population. I wish I were kidding, but I’m not. There’s a lot of technical jargon used in discussing this issue, so in this post I thought I’d try to explain the issues with a somewhat less technical, and hopefully more accessible approach. Technical nitpickers may see some oversimplification, for which I apologize … not at all.

At their most basic level, GPS receivers are pretty close to FM radios.  So to explain some of these principal issues behind the GPS problem in understandable terms, I’ll use the basics of FM radio broadcasting. To tune in an FM radio station, you turn your radio’s dial or push the buttons until the receiving frequency of the radio is set to that of the station: 89.5, 101.7, 104.1, and so on. Those numbers refer to the number of cycles per second of the frequency in millions, so that 101.7 is a radio signal operating at 101.7 million cycles per second, abbreviated as 101.7 MegaHertz (MHz) for short. But that’s just the main frequency, sometimes referred to as the central “carrier wave”; receiving a signal at just at frequency wouldn’t give you any signal information, like music/talk/news. To encode that signal, the frequency of that carrier wave is varied, or “modulated”, by the signal; your radio then monitors those variations in frequency around the central carrier wave’s frequency, and then converts them back to the original signal, music/talk/news. Frequency being modulated = Frequency Modulation = FM.

If you had two stations broadcasting in the same area on the same frequency, they would interfere with each other, making both of them unlistenable. If the frequency is only slightly different, they will also interfere with each other. To prevent this, the FCC licenses broadcasters to transmit on a specific frequency, and also makes sure that the frequencies are far enough apart so that one station’s broadcasts won’t interfere with another station. In the original days of FM, the minimum spacing for FM frequencies was 800 thousand cycles per second (800 KiloHertz or KHz, 0.8 MHz); so if one station was at 90.1 MHz, the closest frequencies allowable to that station would be 89.3 MHz and 90.9 MHz, offset 0.8 MHz up and down from the center one.

With time, the FCC has loosened that frequency spacing requirement up a bit,  taking into account factors like improved FM radio technology, the broadcast power of the station, and the distance from other stations assigned the same frequency. For the most part, the system works, but  you’ve probably experienced occasions when you’ve been listening to one FM station, only to have a second signal cut in and interfere with the first station’s signal. This is especially noticeable if you drive right by an FM radio broadcast antenna; the signal from that station can be so strong, it wipes out reception from any stations that are even marginally close to it in frequency. Because a station requires about 150 KHz of frequency modulation bandwidth to carry its signal, the FCC has also mandated that all standard FM tuning signals need to be at least 200 KHz apart; that’s why your FM tuner jumps from 100.1 to 100.3 to 100.5, bypassing 100.2, 100.4; those frequencies need to be kept free to make sure stations don’t “step” on each other’s signals.

OK, so back to GPS. While GPS doesn’t technically use frequency modulation, it uses a closely-related system called “phase modulation“, which also relies on a carrier wave. The main signal broadcast by GPS satellites, and used by the overwhelming majority of GPS receivers for determing position, is the “L1” frequency, with the carrier wave 1.57542 billion cycles per second (aka a GigaHertz, or GHz); including the total frequency band required for phase modulation, the range is 1.559 GHz  to 1.610 GHz. Phase modulation is used to transmit digital information with pulses 1-millionth of a second wide  from the satellites to your GPS receiver; the receiver takes this data from multiple satellites, and uses it to calculate your position. This frequency was defined in the late 1970s, and has been used continuously for GPS operations since the system went operation early in the 1990s, twenty years now. This frequency band is also part of a larger range of frequencies designated for use in satellite broadcasting. As with FM radio, you need to separate the frequency bands far enough apart so that the signals don’t interfere with each other; you also need to make sure that a signal at one frequency isn’t broadcast at such a high power that it will interfere with signals broadcast at neighboring frequencies. The latter isn’t usually a problem – the signal strength from satellites 12,000 or 23,000 miles above the earth is usually so low that interference between adjacent frequency bands is infrequent.

So, enter LightSquared. LightSquared wants to build a high-speed wireless broadband network on the cheap. Problem is, the FCC holds regular auctions for frequency space, with all the big wireless players (Verizon, ATT, Cingular, Google) bidding billions of dollars for this frequency space to carry their traffic; a smaller company like LightSquared can’t compete financially. But LightSquared came up with several clever workarounds to get past this issue. Satellite frequencies are also regulated and auctioned by the FCC, but they usually go for prices far lower than terrestrial frequency space. LightSquared acquired a small satellite company called SkyTerra that already owned frequency rights for 1.525 GHz to 1.559 GHz, directly adjacent to the frequency band designated for GPS. They then announced plans to develop a satellite-based Internet access service using those frequencies. Satellite signals by themselves would be so weak, that Internet speeds would likely be limited to no more than a few megabits per second, comparable to current 3G wireless network speeds. But FCC regulations have a loophole that allows satellite services to broadcast stronger signals terrestrially to supplement satellite coverage in those areas where coverage might be weak. This terrestrial broadcast signal can be as strong as the FCC allows, and is covered by the satellite auction price paid by the licensee.

So LightSquared announces a “satellite Internet access” service, but one supplemented by free use of terrestrial transmitters. But these terrestrial transmitters aren’t intended merely to fill in gaps in satellite coverage; these are high-power transmitters that allow LightSquared to offer the equivalent of 4G wireless Internet speeds (up to 100 Mbps), without paying for terrestrial spectrum. So that’s how LightSquared plans to do high-speed wireless broadband on the cheap – they don’t have to pay for the frequency spectrum they’re using. It’s a clever use of loopholes, and one I wouldn’t have a problem with, except that they will be broadcasting at high-power at a frequency that will interfere with GPS signals to the point that GPS receivers will no longer operate correctly. And this isn’t just a few transmitters – LightSquared’s plans are to install 40,000 transmitters to cover areas that contain most of the US population.

This GPS interference isn’t just a hypothesis. Members of the US GPS Industry Council, Trimble and Garmin met with the FCC on January 19th to present and discuss Garmin’s tests of the LightSquared proposal (PDF link), and its potential for interference with GPS receivers. Garmin used LightSquared’s own proposed transmitter power levels to evaluate the effects of this transmitters on an automotive GPS (Garmin nuvi 265W) and an avionic GPS (GNS430W). Here are screen captures summarizing the effects of the LightSquared transmitters on GPS receiver performance at different distances:
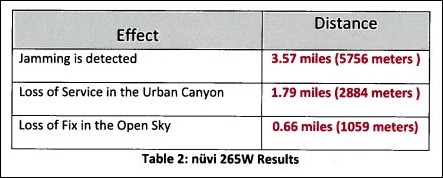
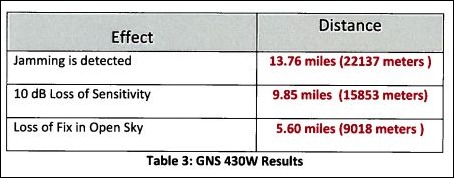
nuvi

GNS

If you get within 0.66 miles of a LightSquared transmitter in open conditions, you’ll lose your position fix with the automotive nuvi 265W, further away in a city environment like New York or Chicago. The results are even worse for the aviation GPS. The FAA has essentially discontinued support for the old LORAN electronic navigation system in favor of GPS, and now LightSquared has proposed a system that essentially disables GPS in exactly the areas aviation needs it most. Garmin’s conclusion, shared by other industry proponents:

The operation of so many high powered transmitters so close in frequency to the GPS operating frequency (1575.42 MHz) will create a disastrous interference problem to GPS receivers to the point where GPS receivers will cease to operate (complete loss of fix) when in the vicinity of these transmitters.

Other government agencies are also concerned. In a January 12th letter to the FCC, Lawrence Strickland, the head of the National Telecommunications and Information Administration (a branch of the Department of Commerce) wrote:

Grant of the LightSquared waiver would create a new interference environment and it is incumbent on the FCC to deal with the resulting interference issues before any interference occurs. Several federal agencies with vital concerns about this spectrum band, including the Departments of Defense, Transportation and Homeland Security, have informed NTIA that they believe the FCC should defer action on the LightSquared waiver until these interference concerns are satisfactorily addressed.

And yet, on January 26th, waiving many of their standard procedures, the FCC gave conditional approval to LightSquared’s proposal (PDF link). The only bone thrown to the GPS community was the requirement that LightSquared work with the GPS community to resolve these interference issues. But since LightSquared is funding the study, there are concerns about how unbiased the results will be. Unless you can change the laws of physics, and principles of electrical engineering, you can’t resolve this problem directly with existing GPS equipment as-is. LightSpeed acknowledged as much when they stated that they saw the main purpose of this joint effort as seeing how to modify GPS equipment to implement “filtering so that they don’t look into our band”. There are only two ways to implement this:

  • Retrofit current GPS equipment with improved electronics; possible but expensive for high-end equipment, impossible at a reasonable cost for consumer-grade equipment
  • Replace all current incompatible GPS receivers with new ones that have improved filtering. While the marginal cost increase on a GPS receiver is likely to be low, the requirement that you have to replace the entire unit will make this staggeringly expensive. Every GPS receiver (automotive, aviation, handheld, mobile phone) would need to be replaced.

There’s additional fodder for conspiracy theorists as well. LightSquared filed its proposal on November 18, 2010, right before Thanksgiving. The FCC fast-tracked its proposal, and limited the comment period to December 2-9, 2010, over the objections of the GPS industry and other opponents. In approving LightSquared’s proposal, they acknowledge waiving some of their requirements (PDF link). And for the real conspiracy fans, the principals behind LightSquared may have political connections deep inside the current adminstration (PDF link). In normal circumstances, I would dismiss all this as nonsense, but the FCC’s decision is blatantly crazy, I have to wonder.

If it weren’t for its detrimental consequences on GPS, I’d think that LightSquared’s system would be a great idea – high-speed wireless Internet access in most populated places, and lower-speed access anywhere in the world by satellite. And if the FCC wants to propose regulations requiring better frequency band filtering in GPS receivers, and other types of satellite-band-based systems, to allow exactly these kind of systems to be developed in the future, I could get on board with that as well. But it should be up to LightSquared to prove that their system won’t interfere with GPS the way it is right now. GPS is the established system – twenty years of operation, hundreds of millions of receivers, uncountable numbers of applications. If LightSquared interferes with GPS, it should be required either to fix the problem itself, or be denied permission to function. That the FCC would even consider LightSquared’s proposal without modification, much less approve it, is astonishing.

If you’re interested in letting the government know how you feel, GPS World has a page on how to contact the relevant members of the House and Senate. GPS World is also the go-to source for coverage of this issue:

Addendum: A great article at InsideGNSS.

And a HT to GPS Tracklog Waypoints for the original link to GPS World.


If It Were My Home: Country Comparison Tool

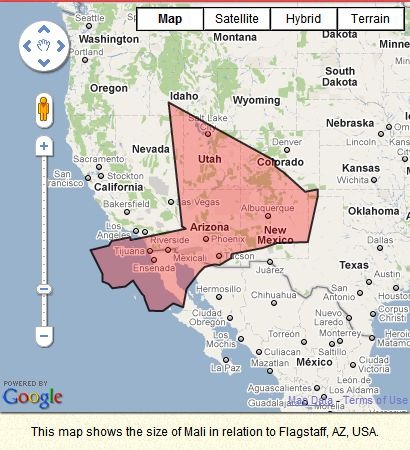
If It Were My Home plots the area of any world country of your choice on a Google Maps view centered around your current location (presumably determined by your IP address):

home1

And gives a comparison of basic demographic characteristics between your country and the one you’ve chosen:

home2

Clicking on any demographic parameter brings up a dropdown with more info:

home3

There’s also a (usually too brief) summary of the country’s history, Amazon links to books, links to social network sites like Facebook for sharing, and a comments section. Oh, and usually some really incongruous ads.


Free GIS Data Acquisition And DisplayTool For The iPad

Don’t have an iPad, and my head is thoroughly into Android, so when I got a comment informing me about Corvallis Microtechnology’s new free iPad application iCMTGIS (iTunes link here), I almost ignored it. Big mistake – this looks like a pretty sweet field GIS data acquisition tool for the iPad!

  • Point, line and area data acquisition, either by GPS, manual entry, or distance/angle value entry
  • Full attribute entry capabilities, including setting up hierarchical data entry forms
  • Attribute query on-screen
  • Multiple data layers
  • Measure/calculate distances and area
  • Use aerial imagery as backgrounds
  • Import shapefile data
  • Export data in shapefile format, or PMP format for use with Corvallis Microtechnology’s own proprietary GIS programs

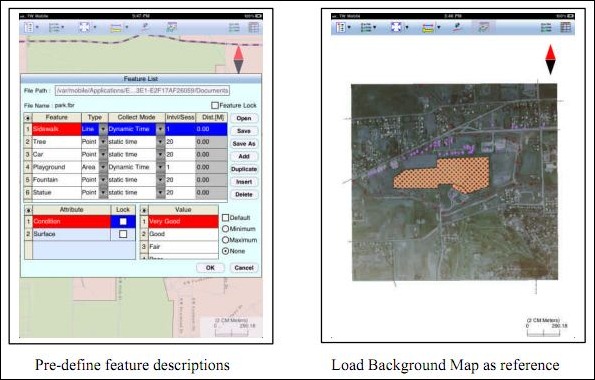
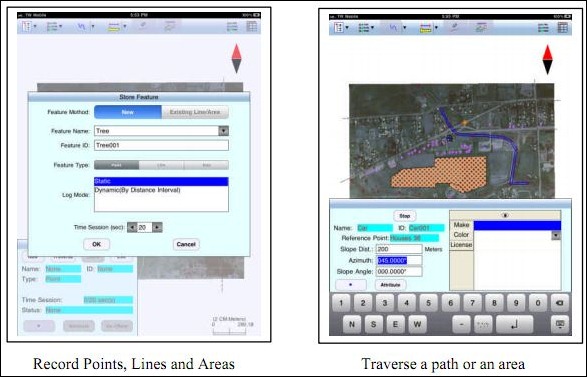
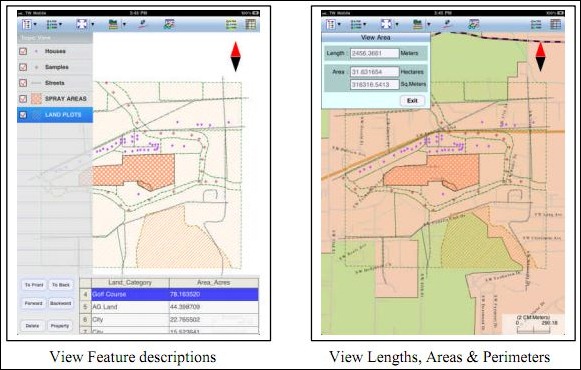
A few screen captures from their PDF brochure:

cmt1

cmt2

cmt3

May not have all the features of an ArcPad or TerraSync, but this sure looks a  hell of a lot easier to use! Almost makes me wish I had an iPad to try it out on; if you give it a spin, leave a note in the Comments section. I have to hope and believe that similar apps will make it on the Android platform in the not-too-distant future.


Mapping America: A Census Data Explorer From The NY Times

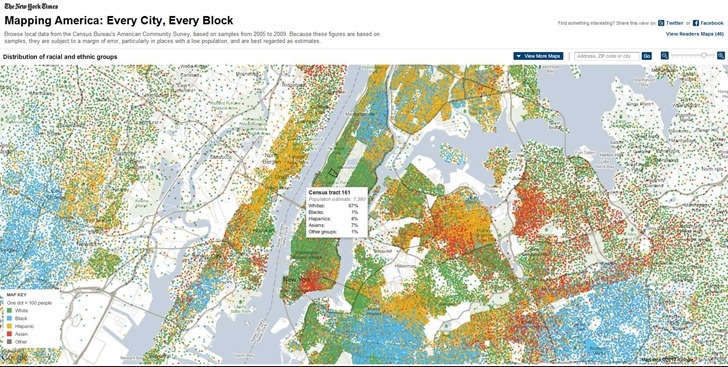
Mapping America: Every City, Every Block, at the New York Times website, takes several limited subsets of US Census data and plots them across the whole country for every census tract (which is at the neighborhood scale for much of the US).

ma_ethnicity

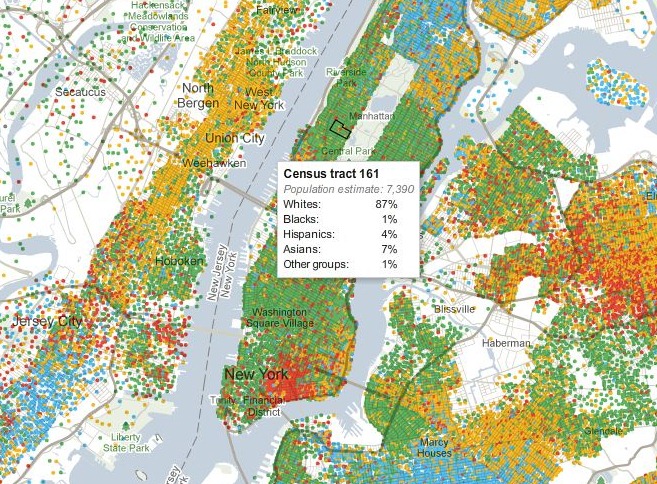
Pass the mouse cursor over the map, and data for every tract shows up in a pop-up window:

ma_ethnicity_2

You can choose a limited number of map variants from the following categories:

  • Race and Ethnicity
  • Income
  • Housing and Families
  • Education

If you come up with a map that looks interesting, you can share it on Facebook or Twitter. No way to export map data, or map graphics (except with a screen capture).