Yesterday’s post was about the latest version of ArcGIS Explorer Desktop, ESRI’s digital globe and GIS data viewer. One of its major advantages over Google Earth is the ability to create “add-ins”, user-programmable plug-ins that add functionality. But there doesn’t seem to be a catalog/gallery of these add-ins at the ArcGIS site. Searching around, I found a bunch of potentially useful ones. Install them by downloading the “eaz” file, then go to the Display ribbong, Options section, click on the Resources link, select “Manage Add-Ins”, and choose the downloaded eaz file. Add-ins will show up either on the Add-Ins ribbon, or in some cases in the Analysis section of the Home ribbon.
Garmin Tools – Converts an ArcGIS display into a KMZ overlay file compatible with newer Garmin units; there was a post on this tool a while back on this site.
Georeferencing – Import a raster image, and then georeference it using a three-point affine transformation. Works well with Mercator-based map projections. Limited support for some raster formats (e.g. doesn’t work with indexed-color TIFF files), and parts of the image can disappear after georeferencing. Finally, you can’t export the georeferenced image, though you can save it as part of the default view in ArcGIS Explorer. Addendum: Whoops – just found a world file and XML file that go with the image file. However, the world file is in geographic coordinates regardless of what the original image’s projection is in; it also includes non-zero rotation parameters, which a fair number of GIS programs can’t handle.
Capture Presentation Slides, Convert Presentation to PPT – Explorer Desktop lets you create presentations from map views. “Capture Presentation Slides” automatically creates a basic presentation by zooming in to every data layer loaded, creating a title from the data name, then generating a slide. “Convert Presentation to PPT” captures the slides as JPGs, then creates a PowerPoint file to display them.
Visibility Analysis – Generate a viewshed from a chosen point using 90m DEM data (maximum distance is 20 km), which is added to the data layers.
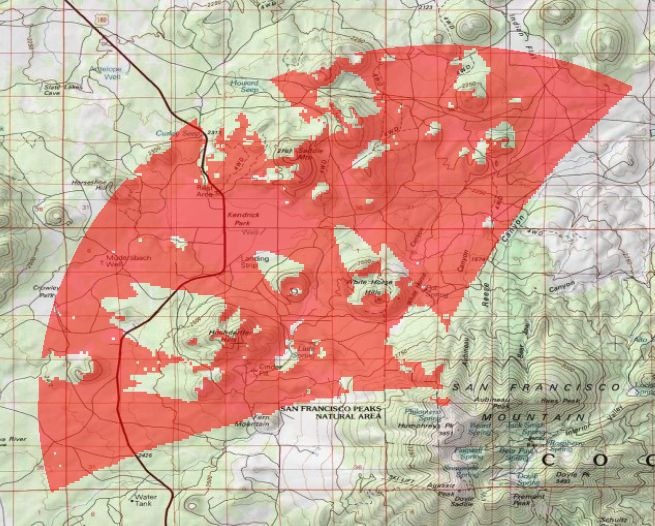
Image Geotagger – Add a previously-geotagged image, or geotag a new image and have it saved under a different name.
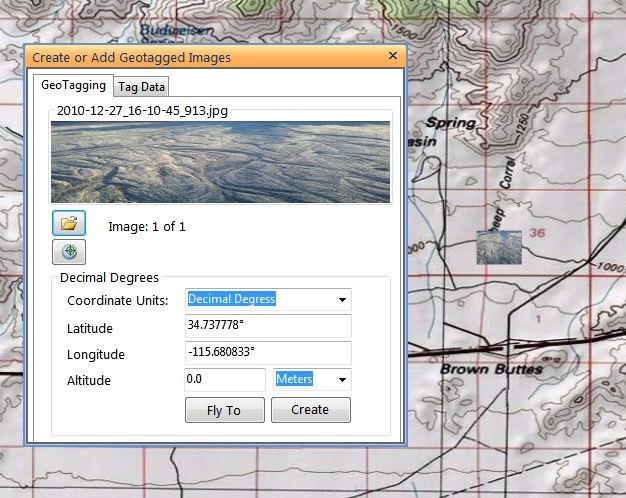
The image will show as a small thumbnail on the map; click on it to bring up a pop-up window with a full-scale view of the picture.
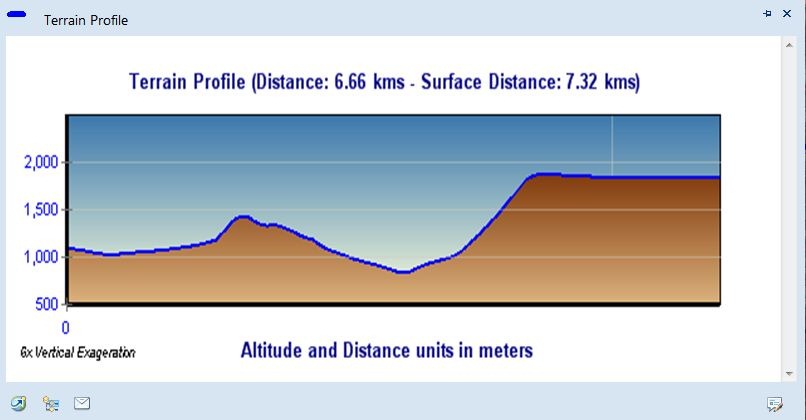
Terrain Profile – Draw a single track line, or series of track line segments, and get an elevation profile along that track.
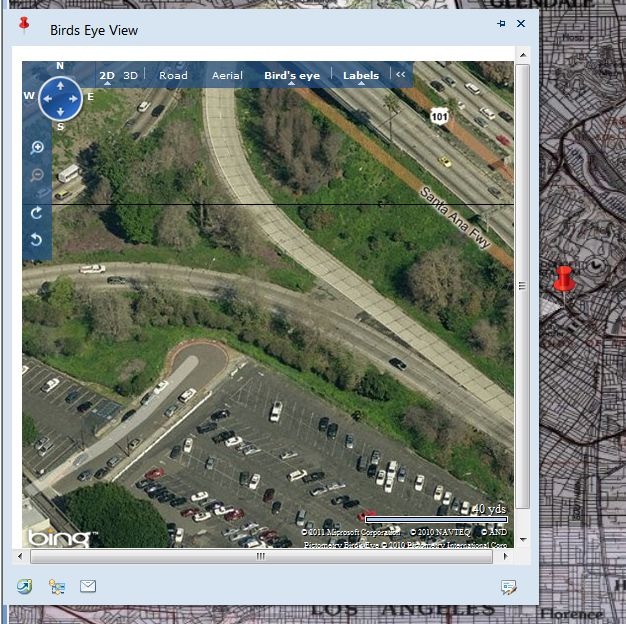
Bing Birds Eye View – Click on the map, and get a pop-up with a Bing Maps window; not just Birds Eye oblique views, but the option for standard Bing Maps as well.
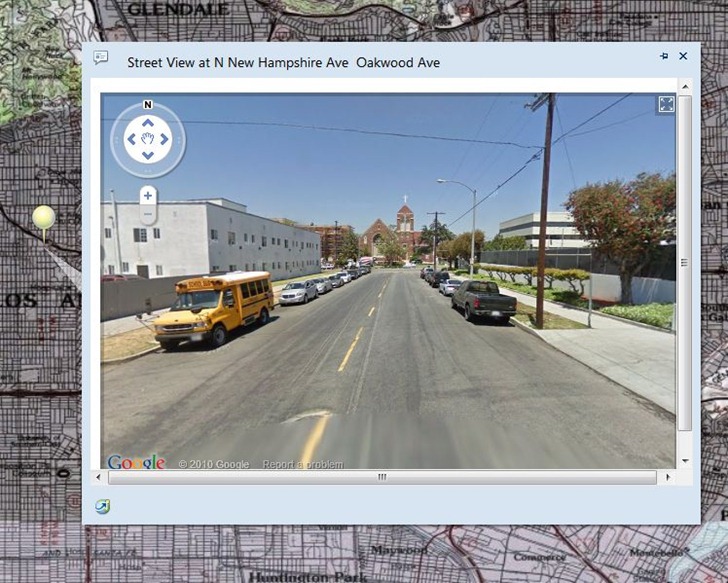
Street Viewer – Similar to the above, but brings up a pop-up window with the Google Street View display (and interactive viewer)
More tomorrow …
So, this Visibility Analysis, using 90m DEM. Does that mean it shows the area from which an object which is 90m high can be seen? Or is it the area from which the point on the ground can be seen? If the latter then what is the relevance of the 90m specified?
The latter- the area from which the point on the ground can be seen. Though I would phrase that as the area that can be seen from the specified point. “90m” refers to the resolution of the elevation data used for the calculation, meaning that elevation data points are spaced 90 meters apart. That’s fine for a ballpark viewshed analysis like this one, but for a more accurate plot, you’d want to use data with higher resolution (30m or 10m).