

Another in a series of posts on free toolsets for ESRI products. Today’s sets comes from Valery Hronusov, author of such useful paid tools as SuperOverlay (a stand-alone program for creating tiled raster image datasets for Google Earth), and KMLer (an extension for ArcGIS that exports data in KML format). The free tools are only for ArcGIS, versions 9 and higher.
Archive for the 'shapefile' Category Page 5 of 9
In a previous post, MicroDEM was used to create viewsheds from a DEM (digital elevation model), and plot them on top of either a DEM terrain image or a corresponding map loaded into the program. But it could be useful to export the viewshed data alone, either in raster or shapefile vector format, for use in other GIS programs. More generally, the need might arise to convert a general raster image of an area into a polygon shapefile. You can do this with the Spatial Analyst extension for ArcGIS, but the two together are pretty expensive. There’s a somewhat painless way to do it with free software.
Continue reading ‘Converting Raster Area Images Into Polygon Shapefiles’
If you need to identify a township or section on map, or plot Public Land Survey Systems (PLSS) boundaries, you can get this data from the Land Survey Information System website, managed by the BLM. Shapefile data is available for most of the US, grouped by state and/or county, in the NAD83 datum. File data includes township, section, subsection, latitude/longitude, and metadata. Note: Make sure you have pop-ups enabled.
There’s also a Township Geocoder web form. Enter the latitude and longitude of the point you’re interested in, NAD27 or NAD83, and get back the state, principal meridian, township, range, section, quarter section, and quarter-quarter section. Or enter the previous data, and get back a latitude/longitude. You can enter individual points, or upload a file for batch point conversion.
A handy source of world vector data, the National Geospatial Agency’s VMAP0 vector data from 1992/1993 has been converted to E00 format and issued as the Digital Chart Of The World. While more recent VMAP0 data is available from the NGA (and even higher-resolution VMAP1 for some areas of the world), it tends to be in the VPF format, which many GIS programs don’t read. While it may be a bit older, DCW data is readily available in E00 format, which many GIS programs can read directly, and it can be converted to shapefile format for compatibility with virtually every GIS viewer and editor.
Penn State maintains the Digital Chart Of The World Server, which offers up DCW data in E00 format by country (and in some cases, e.g. Brazil, Canada, and Australia, by state). Data available includes:
- Political/Ocean (Point)
- Populated Places (Polygon)
- Populated Places (Point)
- Rail Roads (Line)
- Roads (Line)
- Utilities (Line)
- Drainage (Network)
- Drainage (Point)
- Drainage Supplemental (Point)
- Hypsography (Network)
- Hypsography (Point)
- Hypsography Supplemental (Line)
- Hypsography Supplemental (Point)
- Land Cover (Polygon)
- Land Cover (Point)
- Ocean Features (Line)
- Ocean Features (Point)
- Aeronautical (Point)
- Cultural Landmarks (Point)
- Cultural Landmarks (Line)
- Transportation Structure (Line)
You can download the digital vector data directly, or view a GIF preview of the data individually or collectively. Most data is in geographic format (latitude/longitude), with the notable exception of Russia in Lambert Conformal Conic. While the documentation states in one place that the spheroid is the Clarke 1866, it appears from other references that the data is actually in WGS84 datum.
There are a number of free ways to convert shapefiles to KML format for display in Google Earth, but fewer and less flexible shapefile display options for Google Maps. This site lets you upload small line and polygon shapefiles for display in Google Maps, but not in a permanent form, and with limited display options. This other site details a procedure to display polygon shapefiles in Google Maps, but it’s not particularly straightforward to implement. There’s also some direct support for displaying simple KML files in Google Maps, so you could always try converting the shapefiles to KML and then opening them in Google Maps. But there’s a Java application that makes the process reasonably straightforward for polygon shapefiles, shows the data already loaded in a Google Maps interface, and offers some added display options.
Continue reading ‘Thematic Polygon Shapefile Display In Google Maps’
If you were wondering how I created the Google Earth rainfall plot in yesterday’s post on FAO climate data, I didn’t use one of the shapefile to KML converters I’ve posted about. Instead, I used a free program called GE-Graph that takes tabular data and lets you plot it in colors and polygons that depend on the value you’re plotting.
Continue reading ‘Plotting Data In Google Earth Using GE-Graph’
A DEM (digital elevation model) essentially consists of a grid of data, where every square in the grid corresponds to a geographic location, and the value at that position in the grid is the elevation above sea level. But those are just numbers, which are hard to visualize.
3DEM is a free program that opens DEM data and lets you visualize and use it in a number of different ways. It comes with a first-rate PDF manual, available from the Help menu. Today’s post deals with just the basics; upcoming posts will cover some of the interesting ways you can use the data to visualize topography and geography.
Yesterday, I posted about the raster combining and export capabilities of the TatukGIS Viewer. But it’s also a first-rate vector file viewer as well, and can export high-resolution raster images of the vector display using the capability described yesterday.
Among the vector features of the TatukGIS Viewer are:
- Support for a large number of vector formats, including shape, E00, DXF, Tiger road data, GPX, KML, MIF, VPF, DLG, etc.
- Fast display.
- Overlay vector files on top of raster, modify transparency of both.
- A handy wizard for assigning vector display properties using attribute data.
- Standard query and selection by attribute.
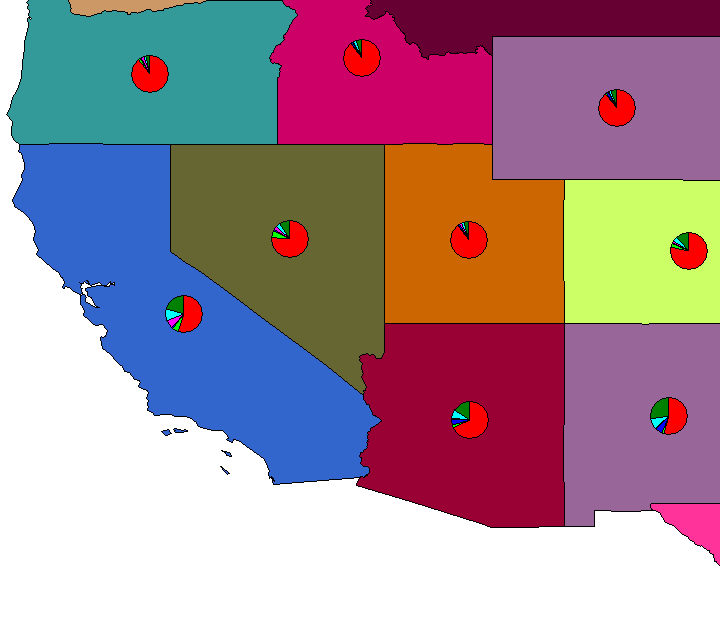
- Pie and bar charts by table attribute, superimposed on the map. (Note: Do this before modifying shapefile display properties, otherwise it doesn’t work)
- Selection by point, line, rectangle, circle, polygon; intersect, touch, within, cross, overlap.
- Measure distance/area for line, polygon, rectangle, circle.
- High-resolution export of georeferenced raster image.
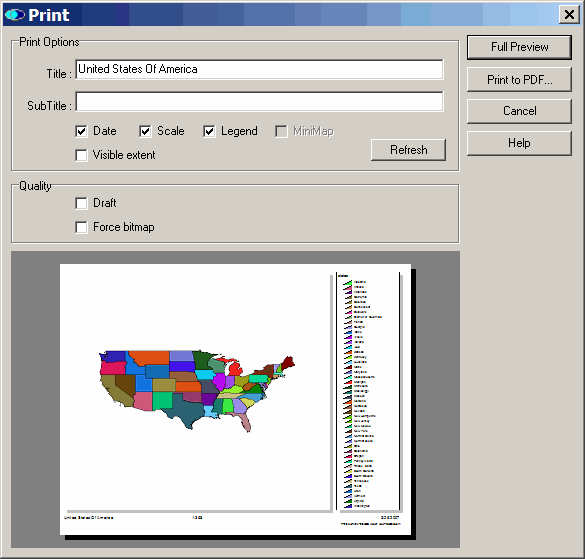
- Print image with options to include scale, title, or legend, either to printer or PDF file.
- User-selectable appearance themes.
- Save projects.
No editing capabilities, just viewing, but the TatukGIS Viewer is among the best free GIS viewers out there.