The best way to display shapefile data in Google Earth is to convert it directly into vector KML format, and I’ve covered several ways to do that for free or cheaply, including stand-alone programs and online converters. Of all these options, I prefer using either shp2kml or Shape2Earth because of the flexibility they offer in setting display attributes like color and shape. But there’s another option: convert shapefile data into a raster image, and then display it in Google Earth as a ground overlay. This has a few advantages over vector KML format:
Continue reading ‘Using Google Earth Ground Overlays To Display Shapefile Data’
GeoConverter: GeoConverter is an online front-end for ogr2ogr which lets you convert a limited number of vector file formats to each other. Free registration is required; while the registration page is currently in German the registration page is now available in English. Formats supported are:
- Comma Separated Value (.csv/(.csvt))
- GPX (.gpx)
- Geographic Markup Language (.gml)
- INTERLIS 1-Transfer Format (.itf/.ili)
- INTERLIS 2-XML Transfer Format (.xml/.ili)
- Keyhole Markup Language (.kml) (write-only)
- MapInfo File (.mif/.mid)
- Shapefile (.shp/.dbf/.shx)
You can convert to/from any of these formats except for KML, which is write-only currently. Formats with multiple files (e.g. shapefiles with .shp, .shx and .dbf files) require that all files to be upload are zipped up into a single file (100 MB max). I suspect the conversion system is Unix-based, which is usually happier with files that have no spaces in their filenames. Also worth remembering that certain formats like GPX and KML require the coordinates to be lat/long WGS84, so you’ll have to make sure your source data is in that coordinate system. I converted a fairly complex polygon shapefile into a KML file successfully, with the attributes written into the KML polygon properties, but there’s no ability to modify display based on attribute properties, as with shp2kml or Shape2Earth.
Thanks to Professor Stefan Keller, one of the creators of this utility, for the tip.
D2M Converter: 5/2/2009: May be dead. A new online utility from Data2Map, currently in beta; free registration required. Converts from any of these formats:
- Access
- Excel
- MS SQL
- ASCII
- MapInfo (.mif)
- ESRI shapefile (.shp)
to either Microsoft MapPoint (.ptm) or Google Earth (KML).
A few notes:
- You have to create a “Conversion Definition” label, or bring up an saved one, for every conversion
- For data formats like shapefile or MapInfo with multiple files, you have to upload every datafile (e.g. shp, shx, dbf for shapefiles).
- 10 MB / 10,000 record limit.
- You need to select one of the attributes with a unique value for each record as the “ID”.
- You can clip out data by geographical bounds, and also to a limited degree by attribute values.
- There are limited abilities to use filters assign colors/pushpin images based on point attributes, and they’re working to add more capabilities. But for now, line/polygon KML files have one color for all shapes.
The service is still in beta, so it may have some quirks, but Data2Map has been very responsive to any issues I’ve encountered.
Zillow has released shapefile boundaries describing neighborhoods in 150 major cities, grouped by state. Available under the Creative Commons license, they’re free for general use in any application as long as you attribute Zillow as the source. Coverage is still limited; in Arizona, only the two largest urban areas (Phoenix and Tucson) are included. But Zillow encourages submissions of neighborhood boundaries for cities not currently covered in their database, and will work on including those submissions after they’re verified. Projection is geographic (latitude/longitude), NAD83.
Phoenix neighborhoods (created with the TatukGIS Viewer)
Via the James Fee GIS Blog.
I’ve posted before about using OpenOffice’s Calc spreadsheet for use as a DBF editor (and why it doesn’t have the serious problem Excel 2003 has with editing DBF files). But Calc isn’t really designed to be a DBF file editor per se, which means that if, for example, you want to add new data columns to your shapefile’s DBF file, you’ll need to know a bit about column data formatting, and that’s kind of a pain. For basic DBF file editing, I find DBF Explorer easier to use, since it’s designed specifically and exclusively to work with DBF files. Adding and defining data column types is easy using the “Structure” button, as is modifying the values of individual data elements and searching for specific text elements (hint: use the Tab key to move to the data record you want to change). You can also delete full individual records, but that can easily screw up the relationship between the shape data and the associated DBF records, and should be done with care. Also be aware that the DBF file is updated continuously as you modify records, so if you want to keep the original unchanged, you should edit a copy of the original file.
Not a particularly fancy interface:
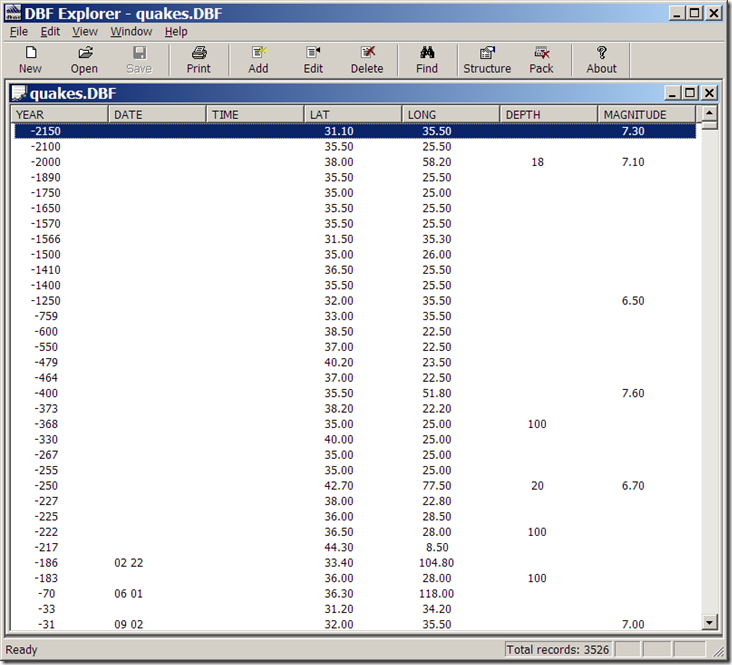
but it doesn’t need to be. And the help file tells you everything you need to know.
Addendum (1/29/08): Dave McGraw points out that if you use the “Structure” button to modify some of the parameters of an existing field, like the name, it will wipe out the data in that field, which is a bad thing; it will give you a warning first, though, that you may lose some data after such a modification. Other parameters, like field type and width, seem to be modifiable without nuking the original data; adding or deleting a field does not seem to cause any problems, either. Another argument in favor of editing a copy of the original, rather than the original itself.
The author also has some other free utilities on his site, including FTP/Web/Mail server software, and a simple install file builder.
Ever get an error message when opening a shapefile like, “Number of shapes does not match number of table records”? Yeah, well, neither have I. But if you ever do have such a problem, the Shape Checker utility might be able to rescue at least some, if not most of your data. It can re-generate a new .shx index file for your .shp file, add or delete lines to the .dbf file to match the number of shapes, and if your DBF file is totally hosed, can recreate a blank DBF for that shapefile. Not great, since you’ll lose whatever data you had in that datafile, but better than losing everything.
As the web page suggests, it’s probably best to do this on a copy of the corrupted file, rather than the original itself. Run the program:
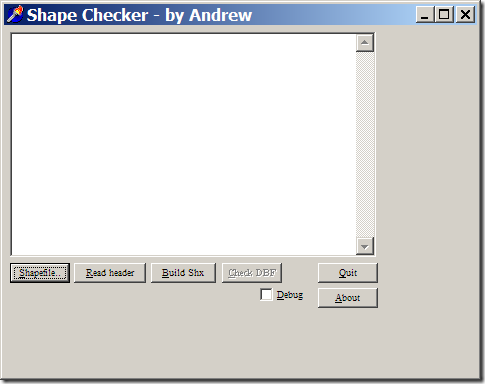
Select the problematic .shp file with the left button, then recreate the .shx file with the “Build Shx” button. You can then check the DBF file for the proper number of records with the Check DBF button; if there are problems, or if the DBF file is missing, you’ll be given the option to fix it or create a blank one from scratch. I’ve tried it on point, line and polygon shapefiles I screwed up deliberately, and it worked as advertised. The program hasn’t been updated since 1999, but the author also provides the Delphi source code if you want to modify it yourself.
One of the first posts on this blog was about the 5.1.1 stable version of DNRGarmin. Long story short, if you work with GIS and you use Garmin units for your data acquisition, this program is a must-have. It can upload/download data in text, DBF and shapefile formats to/from Garmin GPS units, and also comes with an extension for direct interfacing with ArcGIS software. Version 5.1.1 had some utility for non-Garmin GPS units and applications, but version 5.2, currently in beta, has some new features that make it a worthwhile installation for anyone with a GPS.
DNRGarmin has actually been in beta for a while, and I’d been waiting to see if it would come out of beta; the date on the last release is 5/18/07. The webpage indicates in big bold letters that in the beta, “THE ERROR RELATED TO USB CONNECTIVITY AND LOGIN RIGHTS HAS NOT YET BEEN RESOLVED“. But I’ve installed it successfully on 3 different computers without encountering this problem, so there’s a decent chance it should work on yours as well.
New features in version 5.2 include:
- Load data in KML and GPX (in addition to the previous options of text, DBF and shapefile formats)
- Load data directly from the “My Place” pane in Google Earth
- Save data in KML and GPX (along with the previous options of projected/unprojected shapefiles, text and DBF)
- Convert between the different formats
- Collects waypoint time data from supported units
Note: The new version’s ArcGIS extension no longer works with ArcGIS 8.x, only 9.x. If that’s important to you, you should stick with version 8.1.1, still available on the web page. But the new version works fine in stand-alone mode.
Just a brief note to say that the open source GIS MapWindow has reached version 4.4, and the new version is definitely a worthwhile upgrade if you already have the program. A whole bunch of shapefile editing capabilities have been added, there’s now an Undo function in the shapefile editor you can turn on, higher-resolution raster export, plus bug fixes and a few other features. I plan to do a video in the near future demonstrating these new capabilities, similar to the ones I’ve done before on MapWindow.
JS writes, “I am doing a very small wireless operation in Catalonia, and it would be very interesting to have the coverage map of the antennas. Do you know any free (or cheap) tools to do that and place it on Google Earth?” I know of two free Windows tools useful in analyzing radio coverage. The first one is a general purpose terrain analysis program that will give “quick and dirty” plots of line-of-sight coverage and required antenna heights fairly easily. The second, more sophisticated program is specifically designed for determining broadcast coverage and signal strengths, but is also more difficult to use. Getting the data products into Google Earth can take some work, but can be done.
Continue reading ‘Mapping Radio Coverage, And Viewing It In Google Earth’