blankblank blank


Archive for the 'Google Earth' Category Page 16 of 25


"Satellite Destruction Using Google Earth And Orbitron" – Not!

Information Week has an article with the provocative title above making the blogosphere rounds. It supposedly warns us about how easy it would be to blow up a satellite using a free piece of satellite tracking software called Orbitron in combination with Google Earth. If prospective Dr. Evils read the article, though, they’ll see that the inclusion of Google Earth as part of this “system” is gratuitous. Google Earth is only used to “visualize” the satellite position based on the data it gets from the Orbitron software, and would play no part in the actual shooting down. Oh, and you need an operational ground-to-space missile system as well (I have one, but it’s down right now).

There seems to be a fad these days among journalists to treat Google Earth as some kind of military threat based on its satellite imagery; this article pushes that meme to a new extreme. Still, Orbitron is a pretty cool free program for satellite tracking. And if you’re looking for a free multi-platform program to show a visually-appealing map of the night sky, there’s no beating Stellarium.


Useful "Nearby" Utilities For Google Earth

Nearby.org.uk has a page of useful utilities for both Google Earth and Google Maps. Many are UK-oriented, but others have more general utility:

… and more. The whole site is worth poking around, especially if you’re from the UK.


Colored Country/Subdivision Google Earth Polygons With "Color Your Map"

Zonums Solutions has a new free online utility called “Color Your Map” that lets you create a custom KML file representing a country as a filled-in polygon with a specifiable color. For some countries, you can break the representation down further by subdivisions such as province or state, and for the US, you can create state polygons broken down by county.

Continue reading ‘Colored Country/Subdivision Google Earth Polygons With "Color Your Map"’


Animated GIFs In Google Earth

Google Earth supports GIF files as image overlays, with or without transparency, but it doesn’t directly support animated GIFs. However, by “disassembling” the animated GIF into the individual frames, and then assigning each of those frames a time stamp in a KML file, you can re-create the animation effect using Google Earth’s time animation feature.

Continue reading ‘Animated GIFs In Google Earth’


Animating Sea Level Rise In San Francisco With Vector Overlays In Google Earth In One Word: Don't

Last week, I posted the last in my series on animating sea level rise in Google Earth using raster overlays (the “Inconvenient Truth Effect”), and ended with the comment that I would do the same thing with vector overlays, and that doing it that way had some advantages over using raster overlays. Uh, maybe not.

For this effort, I decided to do a vector overlay animation that showed flooding in San Francisco instead of the previous one in Manhattan. Creating a raster animation was pretty straightforward:

Doing the same thing with vector overlays turned out to be a major pain, and even though at first glance the results might look comparable …

… if you look at the results in Google Earth itself, there are big problems with the way it’s rendered at various viewing angles and zoom levels. Read on to find out more.

Continue reading ‘Animating Sea Level Rise In San Francisco With Vector Overlays In Google Earth In One Word: Don't’


The "Inconvenient Truth" Effect In Google Earth: Animated Sea Level Rise Flooding Of Lower Manhattan With An Added Depth Effect

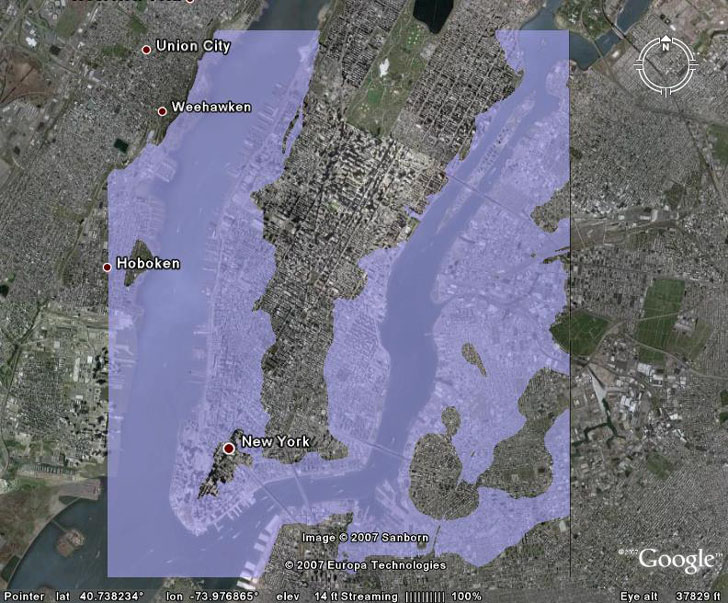
Yesterday’s post showed how to create a sea level rise flooding animation in Google Earth, like this one:

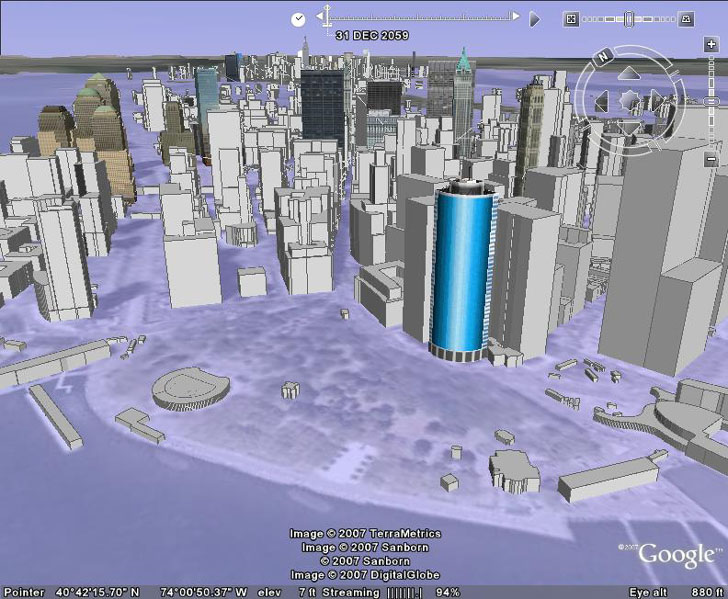
But if you downloaded the KMZ file used to create this animation, and ran it with 3D buildings turned on at the tip of Manhattan, the final image you’d get with 12 meters of flooding looks like this:

downtownnoheight

And there’s a problem with the accuracy of this image: there’s no actual depth to the flooding, i.e. the lower levels of the buildings aren’t covered with water. In fact, some of the buildings you can see in the view above would be completely covered with water if this were a more realistic depiction. That’s because no absolute altitude was assigned to the image overlays used in creating the animation, so they are “clamped” to the terrain level. But by assigning a height to every overlay image in the animation, one can create a realistic effect where the flooding doesn’t just cover more area as the sea level rises, but covers the bottom levels of some buildings, and completely covers other ones. This would be similar to the animations shown in the movie “An Inconvenient Truth”, and in one sense even better. In that movie, the flooding was show in overhead views, while the Google Earth animation can be viewed at an oblique angle of your choosing, with 3D buildings.

Continue reading ‘The "Inconvenient Truth" Effect In Google Earth: Animated Sea Level Rise Flooding Of Lower Manhattan With An Added Depth Effect’


High-Resolution Sea Level Rise Flooding Animations In Google Earth

Creating a high-resolution static sea-level rise image for a specific sea level rise value, and displaying it in Google Earth, is fairly straightforward (see these three posts for the details):

geoverlay1

But creating an animated version viewable in Google Earth, comparable to this animation created in MicroDEM

… takes a bit more work, including diving into the KML code. But while it’s a bit time-consuming, it’s not that hard, and the results are worth it:

Addendum: Do read the rest of this post, but also check out the next post in the series as well for even cooler effects.

Continue reading ‘High-Resolution Sea Level Rise Flooding Animations In Google Earth’


Adding Vector Graphic Objects To Google Earth

This is a minor addendum to the previous post on creating and placing arbitrary raster graphic images and symbols into Google Earth using GIF/PNG transparency. As my chicken scratch writing sample showed, creating quality raster graphic symbols can be a challenge for some, and while there are tools in most raster graphic editors to create high-quality test, shapes and symbols, vector drawing programs usually do a better job on those. It’s possible to use a slightly-modified version of the process in the previous post to bring symbols drawn in vector graphic software into Google Earth.

1. As before, export in image format the area of Google Earth you want to display custom graphics on top of, recording the bounds of the image.

2. Import this graphic jpg image into a vector drawing program. Adobe Illustrator is the best-known COTS program for this, but if you search around, you can find several free programs that do similar things. Examples include Inkscape, a simple, free and open source solution, and Creature House Expression 3, a commercial program now available for free that is very powerful, but has a steep learning curve.

3. Mark the corners of the imported graphic with some kind of symbols; you’ll need these as a guide to cropping later on.

4. Add your vector objects in the appropriate position on top of the raster graphic image from Google Earth.

5. When you’re finished adding vector objects, delete the raster graphic image, leaving behind the vector objects.

6. Export this image as a raster graphic (check your help file to find out how). You’ll get the best results by saving it in a lossless format like TIFF, PNG, or GIF (the last only if the image has less than 256 colors).

7. Open the new raster graphic image in your favorite raster graphic editor, and crop it using the bounds from step 3 as guides.

8. If the resulting cropped raster graphic image is large (greater than 2000 x 2000 pixels), Google Earth may have trouble dealing with it; use the resize function to shrink it down, then save it

From this point on, just follow the steps in the previous post to convert this graphic image to a GIF/PNG file with transparency, and then to place it correctly in Google Earth. Unlike the raster graphic example in the previous post, you may have to move and stretch the image a bit to get it place correctly, depending on how accurately you were able to crop it in step 7.