blankblank blank


Archive for the 'cartography' Category Page 5 of 14


Overlay OpenStreetMap Data Transparently On Google/Yahoo Maps

The transparent com site lets you select a base map layer from Google or Yahoo, and then overlay an OpenStreetMap (OSM) data layer on top with user-definable transparency. Zoom in to your area of interest, pick the base and overlay layers by clicking on the “+” sign in the upper right:
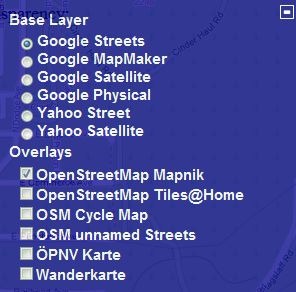
overlayoptions

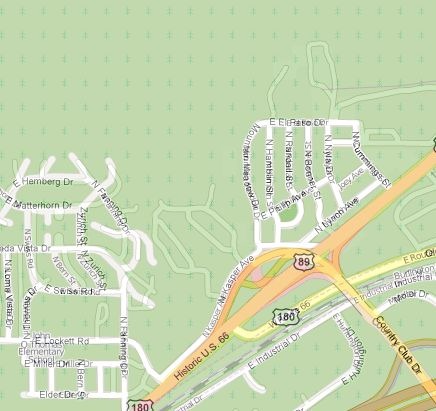
And see the base layer and OSM data together:
overlaymap

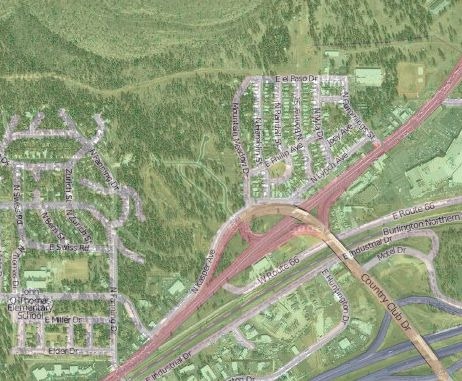
In this area, there are a fair number of roads that show up in Google Maps, but don’t show up in the OSM database; bringing up the Google Satellite view confirms that these roads actually exist:
sat

A cursory check shows that the Google Maps data is more accurate and up-to-date than the OSM data for this area. You can’t use the Google Maps data to correct the OSM maps, but this can be useful in showing you what areas need better mapping data. I’ll have a post soon on OSM editors.
Via GPS Tracklog.


Create A Horizonless Projection View With Terrain Bender

One more brief post on Terrain Bender, a program that lets you create varying-perspective terrain views, analogous to what you get looking from an airplane window: straight-down for nearby terrain, an oblique view for terrain further away:

Continue reading ‘Create A Horizonless Projection View With Terrain Bender’


Getty Thesaurus Of Geographic Names Online

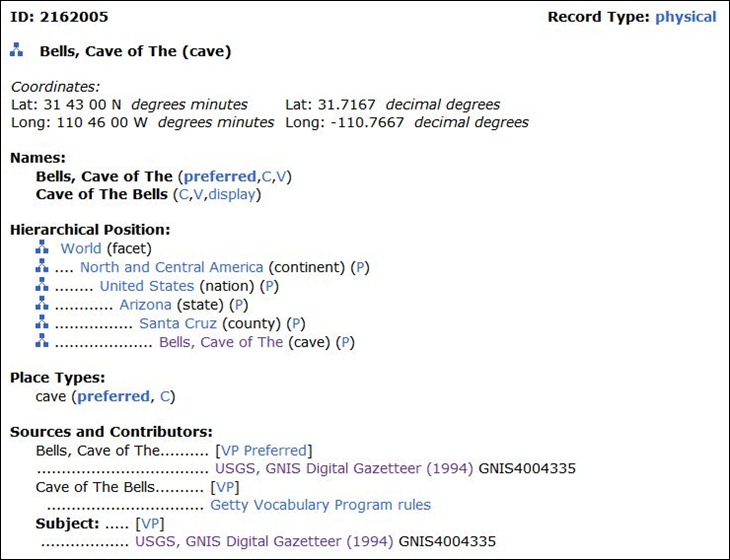
With 895,000 records and 1,115,000 names, the Getty Thesaurus Of Geographic Names Online lets you look up position and hierarchical data for geographic features around the world:

cavebells

The position data is described as “approximate and … intended for reference (“finding purposes”) only”; a few test cases showed that the positions ranged from spot-on to over a mile off for locations in the US. Lookup can be by name only, or limited by type of geographic location and nation; Boolean and wild-card operators are supported.


Excel Add-On For Map And Data Visualization

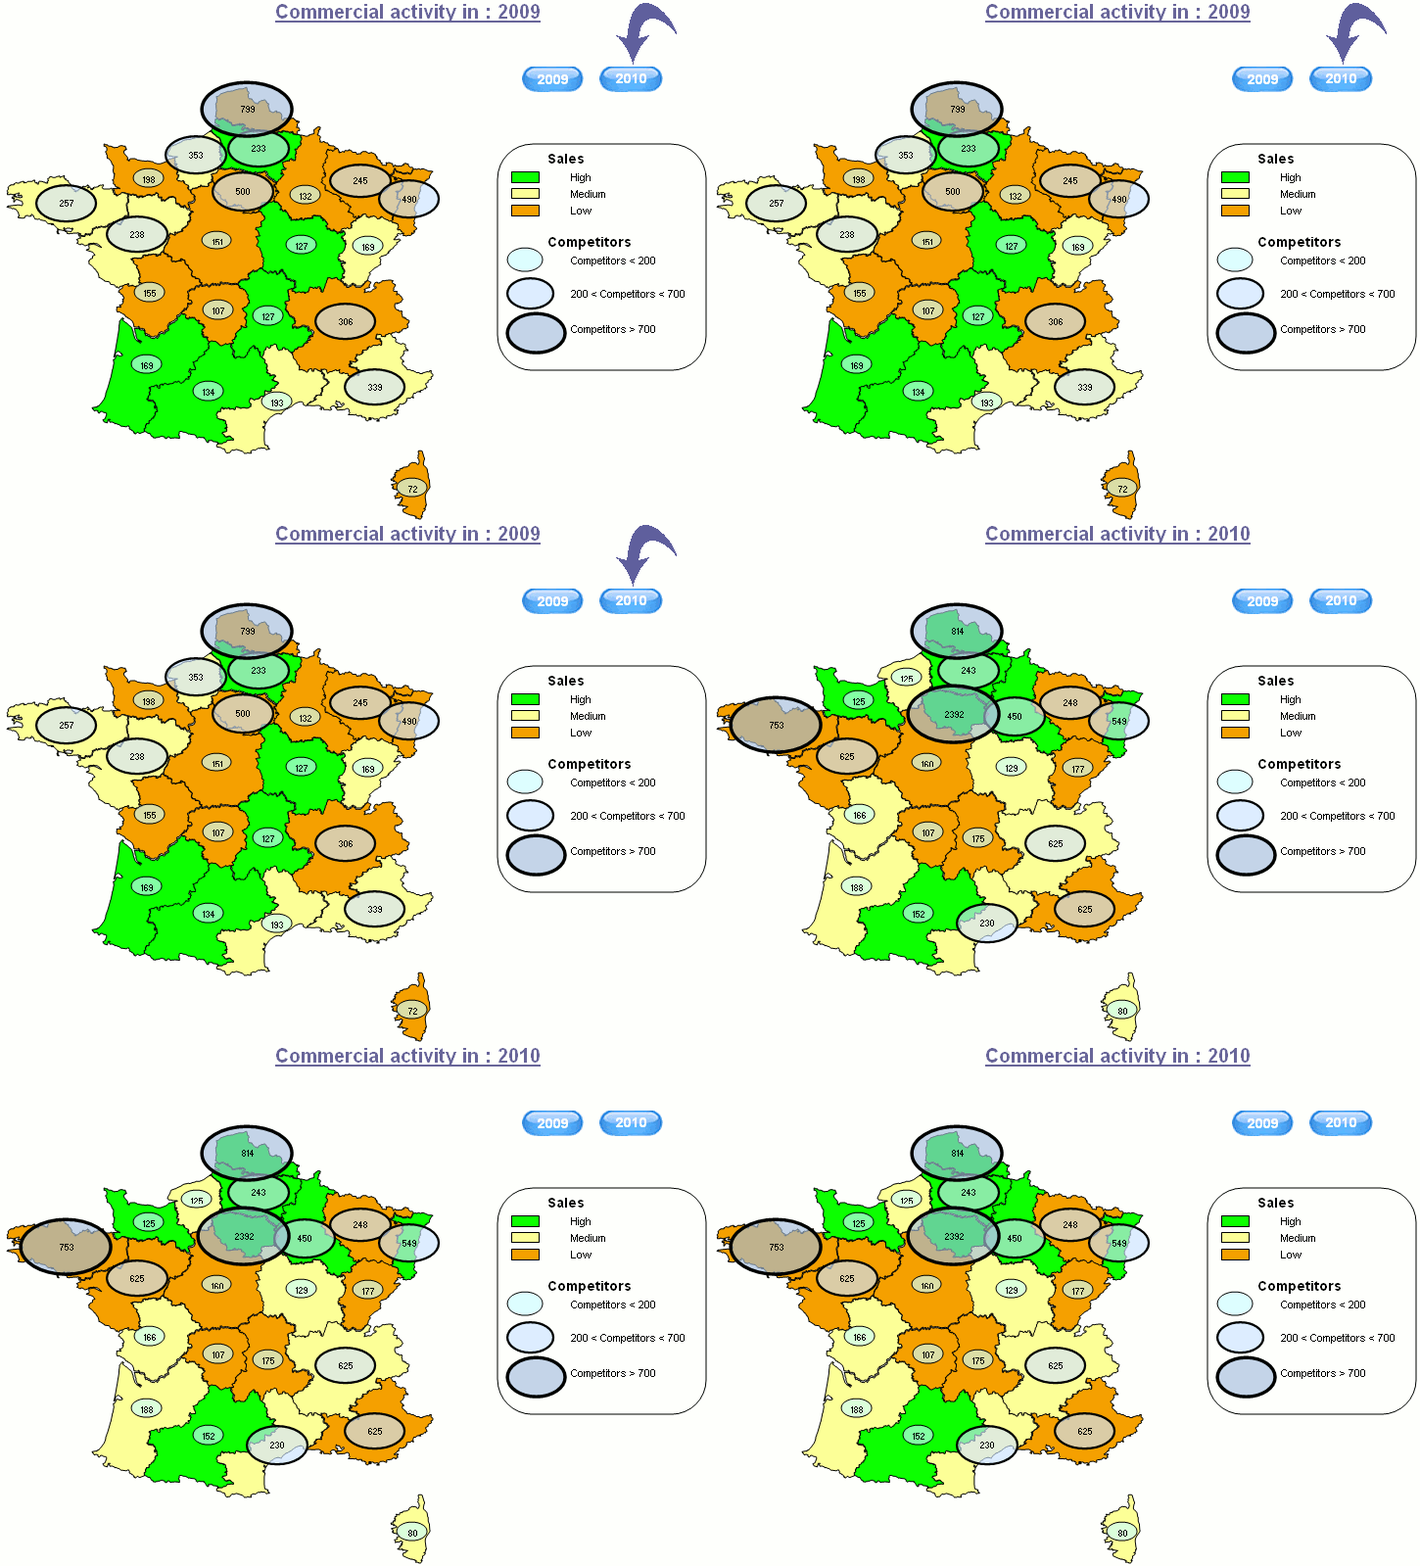
Claude Henri-Meledo writes to tell me about BeGraphic Lite, a free data visualization tool for Microsoft Excel. I don’t currently have easy access to Microsoft Excel (I’m working in OpenOffice exclusively), so I can’t try it out, but it looks interesting. It apparently does a wide variation of data graphics, not just maps; these include:

cascade chart / waterfall chart, marimekko / mekko chart, sankey diagram, dynamic diagram, pivot diagram, powerpivot charts, pivot chart, ishikawa cause-effect diagram, BCG matrix, ADL matrix, McKinsey 7S, RB profiler, DuPont chart, choropleth map, swot analysis model, vector glyph, business chart, business graph, business graphics, professional excel chart, mini-graphs, micro-charts, sparkline for excel, excel gauges, strategic maps, strategy map, dashboard software, moving bubble, motion chart, trend analyzer, scada system, control room, make a custom map in Excel, thematic map in PowerPoint, dynamic sales territories, mapping tool, geographical information system in excel2010, choropleth map,  and any innovative charts…

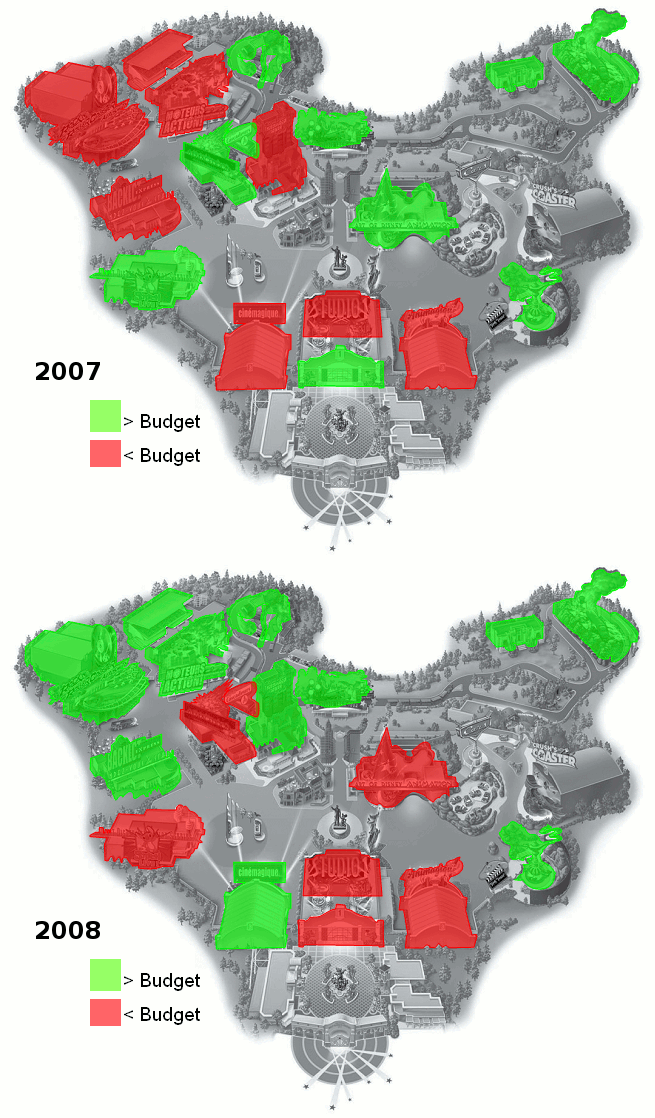
A few sample map screenshots from the website:

France

Disney

BeGraphic LIte works with the free vector graphic map data available at d-maps.com, which now has 7500 maps available (up from 4000 when I posted about the site in August 2009). Edit: You need to download the files in WMF format. There’s a Pro version of BeGraphic in the works for later this year, but the Lite version will still be free and available.


Two OpenStreetMap Data Tools

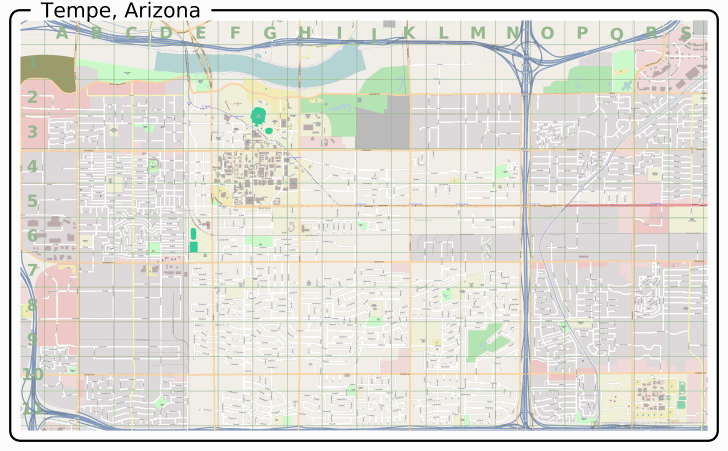
MapOSMatic – Select an area by a bounding box, or by administrative boundaries (database for the latter is currently very limited), and get a map of the area in PNG, PDF, and/or SVG format, with letter/number grid indexing:

TempeArizona

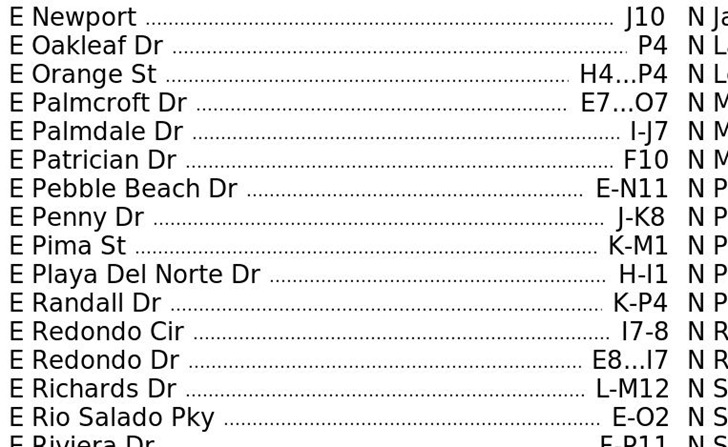
And also get a street index for that map referenced to the letter/number grid:

streetindex

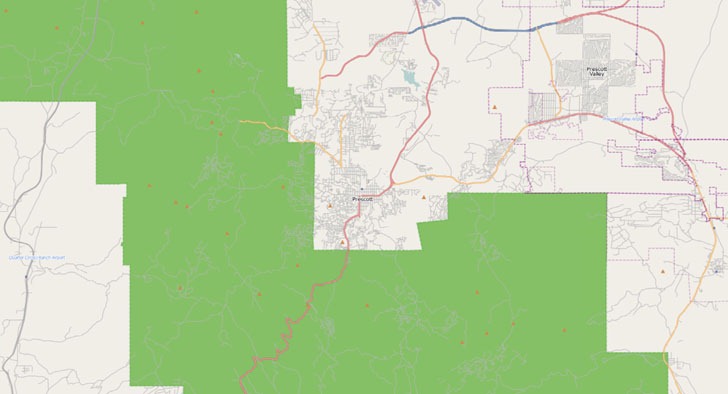
OSM Extractor: Select an OSM map area by bounding box, and download georeferenced raster or vector data for that area. Vector data is available in shapefile or native XML format, but to limit its size, you have to zoom in to city level to download it. No such area limitations on raster data in GeoTiff format:

prescott

But it only saves the data in screen resolution, which limits the detail level. All data is in geographic (Plate Carree) projection, WGS84. If you have a pop-up blocker, you’ll need to set an exception for “vizure.com” so that the data download pop-up can appear.

Via SlashGeo.


Two Online Map Scale Calculators

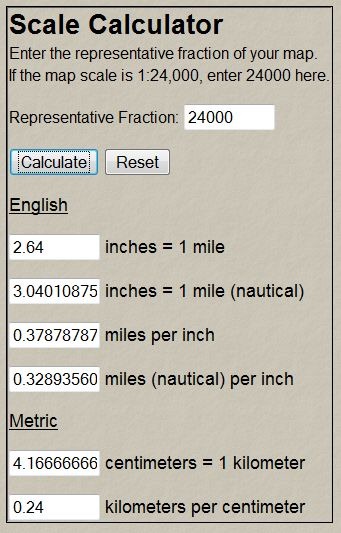
With the UT-Bureau Of Economic Geology’s Scale Calculator, enter a map scale and it calculates what a measurement on the map represents in reality, or what a unit distance translates to at that map scale:

utscale

There are also links at the top of the page to other calculators for area/distance conversion, and decimal degree / deg-min-sec degree conversions (both ways).

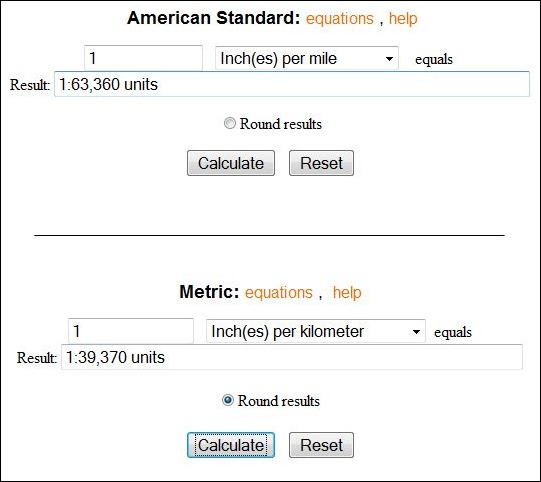
The OSU Scale Calculator is a bit different – enter a map measurement distance for a unit distance, and get back the map scale number:

osuscale

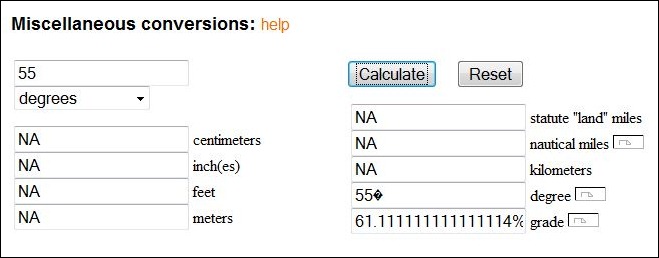
There’s also another calculator for basic distance unit conversions, plus also conversions from degrees of slope to  % grade and back:

slopegrade

Via Kelso’s Corner (which also has some useful tables and info related to map scale),


Atlas Obscura

The Atlas Obscura describes itself as “A Compendium Of The World’s Wonders, Curiosities And Esoterica”. That’s probably overstating its geographical coverage a bit, since the largest number of entries by far are for the US, with Western Europe a distant second. Still, you’ll find lots of interesting and odd destinations, grouped geographically by continent, and also categorically. These categories aren’t typical ones found in guidebooks; for example, under “Wonders Of Salt” you’ll find 15 entries like the Salt Men Of Iran, and the Blood Falls of Antarctica. Other categories include “Bioluminescent Spots”, “Small Worlds And Model Towns”, and “Astounding Timepieces”. There’s a scrollable pictorial category index on the home page, but it’s a bit clumsy to use; better to jump right to the Categories page. Finally, if you know of an interesting or odd site that would fit in, you can submit it for inclusion in the Atlas.


Natural Earth Data In Google Earth

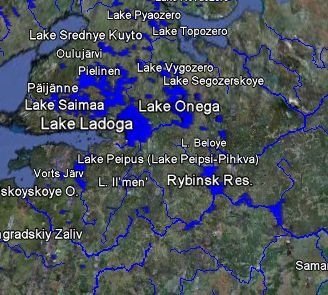
Last week, I posted about the new Natural Earth datasets, free medium-scale vector data for the earth to go along with the previously-available Natural Earth physiographic raster data. The Google Earth Library now has a KML network link that lets you view much of this data in Google Earth as layers, like here with lakes and rivers:

lakesrivers

Obviously, most of these features will be visible in Google Earth as soon as you zoom in, but these datasets let you view features with names at lower zoom levels, and more distinct colors. Plus, this offers a quick preview of the data available from Natural Earth, so you can see whether it meets your needs for use in a GIS or mapping program in shapefile format. There’s also an overlay with the raster physiographic imagery:

him

All of the data is in KML network links in subfolders of the main link, and some datasets will take a while to load. It’s also probably a good idea to not check the box next to the main network link, as this will load all the data into Google Earth, which will take a while.