Via Ogle Earth, a new way for two people to share and show positions in Google Earth, GE Sharing. Unlike Unype, which requires a Windows-only download, this uses a shared network link, making it cross-platform. Site is in German, but if you click on the “Los geht’s!” (“Let’s go!”) button, and follow Stefan’s English description at Ogle Earth, it should be pretty straightforward.
Addendum: Here’s the link to the English version of the page.
A handy source of world vector data, the National Geospatial Agency’s VMAP0 vector data from 1992/1993 has been converted to E00 format and issued as the Digital Chart Of The World. While more recent VMAP0 data is available from the NGA (and even higher-resolution VMAP1 for some areas of the world), it tends to be in the VPF format, which many GIS programs don’t read. While it may be a bit older, DCW data is readily available in E00 format, which many GIS programs can read directly, and it can be converted to shapefile format for compatibility with virtually every GIS viewer and editor.
Penn State maintains the Digital Chart Of The World Server, which offers up DCW data in E00 format by country (and in some cases, e.g. Brazil, Canada, and Australia, by state). Data available includes:
- Political/Ocean (Point)
- Populated Places (Polygon)
- Populated Places (Point)
- Rail Roads (Line)
- Roads (Line)
- Utilities (Line)
- Drainage (Network)
- Drainage (Point)
- Drainage Supplemental (Point)
- Hypsography (Network)
- Hypsography (Point)
- Hypsography Supplemental (Line)
- Hypsography Supplemental (Point)
- Land Cover (Polygon)
- Land Cover (Point)
- Ocean Features (Line)
- Ocean Features (Point)
- Aeronautical (Point)
- Cultural Landmarks (Point)
- Cultural Landmarks (Line)
- Transportation Structure (Line)
You can download the digital vector data directly, or view a GIF preview of the data individually or collectively. Most data is in geographic format (latitude/longitude), with the notable exception of Russia in Lambert Conformal Conic. While the documentation states in one place that the spheroid is the Clarke 1866, it appears from other references that the data is actually in WGS84 datum.
A reader from New Zealand writes, “I’m looking for a tool that will assist in the production of 3d terrain models from GPS elevation and track data. Ideally I would be able to walk over the land and generate continuous track data that could then be used to build a 3d mesh with the ability to refine it over time, fill in areas with higher detail. What is the best tool (in your opinion) for achieving something like this?” Can’t think of a single tool off the top of my head, but several ideas for possible approaches to handling this kind of data come to mind. But while this might be a good idea conceptually, it relies on the assumption that you can get accurate, consistent, repeatable position and altitude data from a GPS. And that’s not a good assumption.
Continue reading ‘Can You Use GPS Data To Make A DEM?’
Via GISUser.com, a link to the HeatMapAPI website that offers a free basic API (and advanced paid one) to create heat maps:
“a graphical representation of three dimensional data (X, Y and Value) on a two dimensional surface by using colors”.
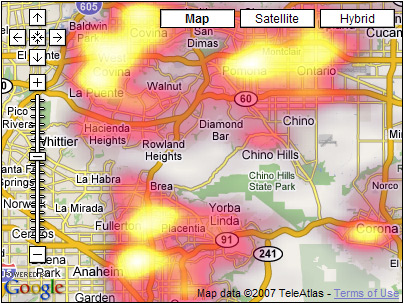
If you have a shapefile, you could create a similar kind of map using Google Map Creator as well.
Once upon a time, LizardTech, the owners of the Multiresolution Seamless Image Database (MRSID) compressed image technology often used with satellite and aerial imagery, had a free stand-alone viewer available on their website. Using this viewer, you could open full MRSID images, and export re-sampled subsets as TIFF images, GeoTiffs if the MRSID file was georeferenced or came with a world file. But LizardTech dropped the link for that stand-alone viewer download from their website some years ago, and now they only offer a browser plug-in that only allows viewing of MRSID images, and command-line utilities that convert the entire MRSID file into what could be an enormous TIFF image file.
But the Internet being what it is, it’s difficult to eliminate a file completely, and there are a couple of locations that still have the stand-alone MRSID viewer available for download. The Library Of Congress has many downloadable maps in MRSID format, and they offer a download link to both the viewer install program and the PDF manual (there’s also a viewer and manual available for Macintosh OS 9.x). The Spatial Analysis Laboratory of the University Of Arkansas at Monticello also has the install program, along with a downloadable PDF lesson on how to subset a georeference MRSID file and export it as a GeoTiff.
You can also use the free TatukGIS Viewer (Windows only) to open, view, and export MRSID files as well.
18,000 years ago, at the height of the last ice age, much of the Northern and Southern Hemispheres were covered by ice, and the climate and ecosystems were dramatically different. The Review And Atlas Of Palaeovegetation has links to maps and web pages describing the changing climate from 18,000 years and more ago.
Continue reading ‘Ice Age Palaeovegetation Maps’
The fine people at the University College of London’s Centre for Advanced Spatial Analysis, the same ones who released the Google Map Creator described in the previous post, have also released Image Cutter, a program that allows you to use the Google Map pan-and-zoom interface to display a tiled large image at various scales. Written in Java, it will run on Windows, Mac, and Linux.
The obvious applications are for general digital images, where it can be used to view them at both large and small scales. This could be useful for displaying maps where you don’t want or need to have geographic coordinates associated with the map (e.g. a general city or college map, or perhaps an imaginary or unusual map from the Strange Maps blog). The image tiles and associated HTML code can uploaded to and hosted at the webserver of your choice.
There’s a Web 2.0 service called MapLib.Net that performs the same function, but also hosts the images for you. There’s a free account with a max storage space of 30 MB, and a maximum image size of 6000 x 6000 pixels; various paid plans are also available that offer larger image sizes and more storage space.
There are a number of free ways to convert shapefiles to KML format for display in Google Earth, but fewer and less flexible shapefile display options for Google Maps. This site lets you upload small line and polygon shapefiles for display in Google Maps, but not in a permanent form, and with limited display options. This other site details a procedure to display polygon shapefiles in Google Maps, but it’s not particularly straightforward to implement. There’s also some direct support for displaying simple KML files in Google Maps, so you could always try converting the shapefiles to KML and then opening them in Google Maps. But there’s a Java application that makes the process reasonably straightforward for polygon shapefiles, shows the data already loaded in a Google Maps interface, and offers some added display options.
Continue reading ‘Thematic Polygon Shapefile Display In Google Maps’

