Note: Version 6.15.3 of MapSource accidentally dropped support for custom waypoint icons; version 6.15.4 puts it back. Make sure you have the most recent version.
In the first post of this series, I started describing the process of creating and uploading a custom waypoint icon to a Garmin mapping GPS unit; little of what follows will make sense unless you read that first. Today, the thrilling semi-conclusion!
Continue reading ‘Creating Custom Waypoint Icons For Garmin GPS Units II’
Note: Version 6.15.3 of MapSource accidentally dropped support for custom waypoint icons; version 6.15.4 puts it back. Make sure you have the most recent version.
Modern handheld Garmin GPS units with map displays come with an absurd number of icon choices to use when designating and displaying a waypoint. My Garmin 60Cx comes with:
- 18 Transportation
- 12 Markers
- 18 Civil
- 24 Outdoors
- 24 Marine
- 18 Navaids
- 24 Signs
- 24 Points of Interest
But if those aren’t enough for you, or a specific icon graphic you’d like to see isn’t included, it’s possible with many Garmin units (like my Garmin 60Cx) to create your own waypoint icons and upload them to your GPS unit. To find out if your unit supports Custom waypoint icons, create a waypoint, select the icon image, and see if “Custom” as a subcategory of waypoint icons, along with the others listed above:
Continue reading ‘Creating Custom Waypoint Icons For Garmin GPS Units I’
Yesterday, I posted about a NOAA site where you can download Raster Navigation Charts (RNC), maps of coastal and inland waterways. The charts are currently only available in BSB format, which many GIS programs can’t handle; I linked to a few free viewers that will let you view the maps, but not export them. They’re also only available in the Mercator NAD83 projection/datum. Peter Guth (the author of the terrain analysis GIS MicroDEM) let me know about a free utility available from NOAA called the Digital NOAA Nautical Chart Reprojector. It lets you re-project the BSB maps into one of 32 projections (e.g. geographic or UTM) and over 100 datums, then exports the chart in BSB, RAW or TIFF format with a world file; the latter virtually every GIS program and graphics editor can open. It looks like it was originally a command-line utility, since a DOS box pops up when you run the program, but it now comes with a GUI:

The Input File and Output File dialog windows are a bit clumsy to use until you figure them out, but for the input file, you’re looking for the .kap file that came with the zip file you downloaded from the NOAA mapsite. Choose the desired output parameters at right, including choice of output file format (TIFF here), projection (UTM) and datum (WGS_84). The GUI doesn’t set the UTM zone automatically, but you’ll see the West and East Bounds for the map in the Input Info window at left, and can use those as a guide for setting the correct UTM zone with the Projection Parameters dropdown at right. In this case, clicking “Run” will create the TIF file specified as the output file, along with its worldfile. The file extension for that worldfile will be .tifw; if your GIS program doesn’t accept that, try changing it to the more-commonly seen .tfw extension.
NOAA also has a free extension called Chart Viewer that lets you open BSB charts natively in ESRI’s ArcView and ArcGIS, and Leica Geosystems’ Imagine.
NOAA’s Office Of Coast Survey has downloadable copies of regularly-updated RNCs (Raster Navigation Charts). The updated charts are in BSB format, not supported by many GIS and graphic software programs, but there’s a list of links to free and demo software packages capable of displaying BSB files in georeferenced format (like Caris EasyView and GPSNavX). The site indicates that NOAA will issue GeoTiff versions of these charts at some unspecified point in the future, but those charts will not be as regularly updated as the BSB charts will. Selection is either by chart number or a graphical viewer (requires Java):
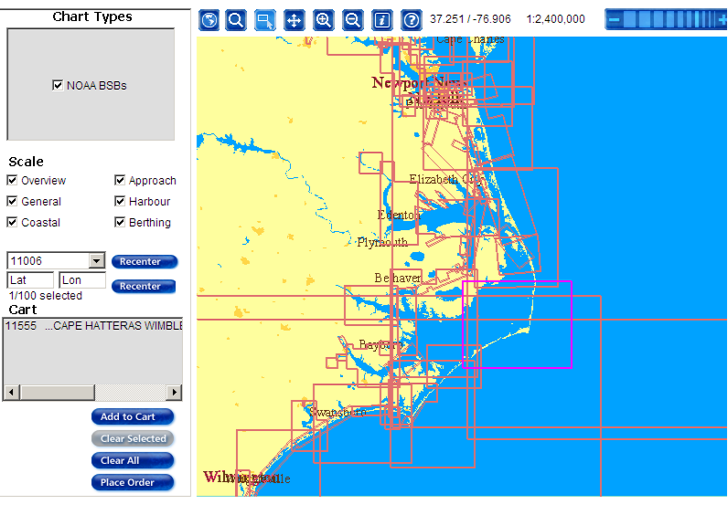
To choose a chart for downloading in the graphical viewer, click the “Selection Mode” button at the top, then click on the rectangle defining the chart area (clicking inside the rectangle does nothing). Click “Add To Cart” at left, which adds it to a list of charts to be downloaded. When you’re done selecting charts, click on “Place Order”, and follow the directions to get a zipped copy of the BSB chart (response time to the button-pushing may be slow):
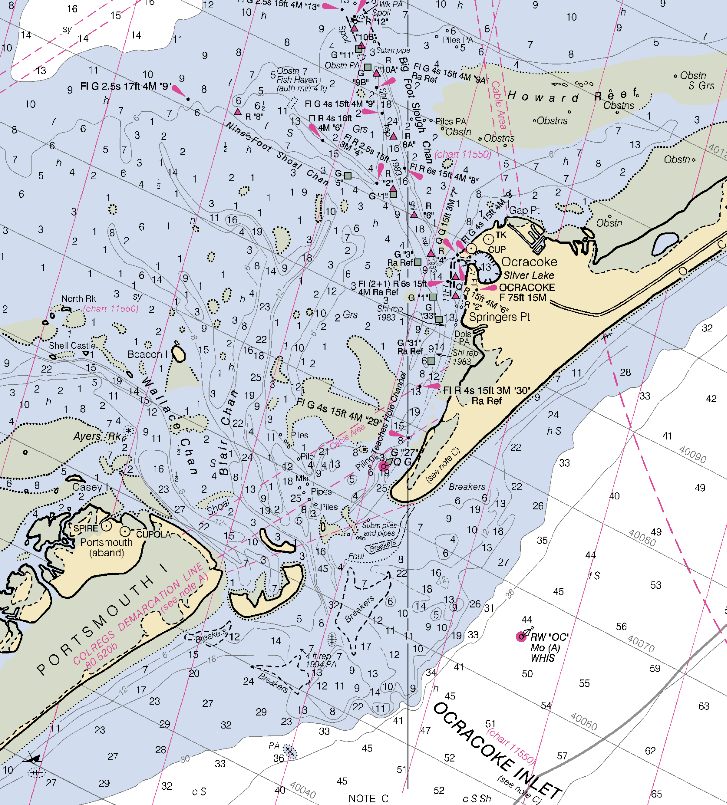
Native map projection for the georeferencing is Mercator NAD83, in meters.
GeoConverter: GeoConverter is an online front-end for ogr2ogr which lets you convert a limited number of vector file formats to each other. Free registration is required; while the registration page is currently in German the registration page is now available in English. Formats supported are:
- Comma Separated Value (.csv/(.csvt))
- GPX (.gpx)
- Geographic Markup Language (.gml)
- INTERLIS 1-Transfer Format (.itf/.ili)
- INTERLIS 2-XML Transfer Format (.xml/.ili)
- Keyhole Markup Language (.kml) (write-only)
- MapInfo File (.mif/.mid)
- Shapefile (.shp/.dbf/.shx)
You can convert to/from any of these formats except for KML, which is write-only currently. Formats with multiple files (e.g. shapefiles with .shp, .shx and .dbf files) require that all files to be upload are zipped up into a single file (100 MB max). I suspect the conversion system is Unix-based, which is usually happier with files that have no spaces in their filenames. Also worth remembering that certain formats like GPX and KML require the coordinates to be lat/long WGS84, so you’ll have to make sure your source data is in that coordinate system. I converted a fairly complex polygon shapefile into a KML file successfully, with the attributes written into the KML polygon properties, but there’s no ability to modify display based on attribute properties, as with shp2kml or Shape2Earth.
Thanks to Professor Stefan Keller, one of the creators of this utility, for the tip.
D2M Converter: 5/2/2009: May be dead. A new online utility from Data2Map, currently in beta; free registration required. Converts from any of these formats:
- Access
- Excel
- MS SQL
- ASCII
- MapInfo (.mif)
- ESRI shapefile (.shp)
to either Microsoft MapPoint (.ptm) or Google Earth (KML).
A few notes:
- You have to create a “Conversion Definition” label, or bring up an saved one, for every conversion
- For data formats like shapefile or MapInfo with multiple files, you have to upload every datafile (e.g. shp, shx, dbf for shapefiles).
- 10 MB / 10,000 record limit.
- You need to select one of the attributes with a unique value for each record as the “ID”.
- You can clip out data by geographical bounds, and also to a limited degree by attribute values.
- There are limited abilities to use filters assign colors/pushpin images based on point attributes, and they’re working to add more capabilities. But for now, line/polygon KML files have one color for all shapes.
The service is still in beta, so it may have some quirks, but Data2Map has been very responsive to any issues I’ve encountered.
Part I covered a number of ways to improve the accuracy of GPS position measurements using a standard consumer-grade unit. Here are a few more ways to improve your chances of getting an accurate position determination.
Continue reading ‘Improving Position Measurement Accuracy In Consumer-Grade GPS Receivers – Part II’
Bill Clark, the author of the useful Google Earth Public Land Survey System (PLSS) tool, has a new online app for converting spreadsheet data into point KML files, and opening them directly in Google Earth. Spreadsheet files can be in XLS (Office 2003 or earlier for now, Office 2007 support coming), CSV, or TXT (tab-delimited format); the minimum data required includes only latitude and longitude (either decimal or degree-minute-second formats are acceptable). Optional additional data accepted includes:
- Name for each point
- Description (text for pop-up balloon)
- Icon (use the table on the web app page to select a number corresponding to the desired icon graphic)
- Formatting tags (size and color of icon, altitude, connecting lines)
Make sure the column headings are included, exactly as specified on the web page’s instructions; there’s an option on the web page to review the spreadsheet data online to make sure it’s correct. The data is formatted into KML at the server, then sent back to your computer to be opened in Google Earth; the original data is then deleted at the server end for security. If you want to save the data displayed in Google Earth, make sure you right-click on the data item in the Places window on the left, and save it in either KML or KMZ format.
My previous post recommended using an external GPS antenna to improve accuracy. They aren’t actually all that expensive – you can pick one up for $20-30 on eBay. But for really cheap GPS antennas, you might try one of my favorite gadget sites, DealExtreme. You can get an external GPS antenna for as little as $7.50, or as much as $8.31, a price that includes shipping from Hong Kong. I have no experience with either model, no specs are given, and the connector description (“F-Cable”) is one that I’m not familiar with, so caveat emptor (“let the buyer beware”). Still, at this price, you don’t have much to lose.
DealExtreme is full of both useful and oddball gadgets, many at absurdly low prices, especially given that all the prices include shipping. Geographically-related, in addition to a few GPS-related items like the antennas, they also have dozens of compasses, from a digital compass with a built-in altimeter and thermometer for about $30, to a twenty-pack of mini-compasses for $2.60. Not to mention the combination butane lighter and compass for $4. Thousands of other items as well, from the useful to the absurd (Mario and Luigi air freshener, anyone?), most at astoundingly low prices. Takes a few weeks for the items to show up, but I’ve never had a problem with any order, including the one item that was out-of-stock (got a prompt refund).

