Bruce Ralston of the University of Tennessee has previously released several US Census TIGER data tools that I’ve posted about in the past. TGR2SHP converts TIGER files into shapefile format, while TGR2KML converts TIGER polygon files (like legislative districts and county subdivisions) into basic KML files for viewing in Google Earth. Both of these tools only work with the older pre-2007 TIGER format, which is no longer in use; the Census Bureau now issues all this TIGER data in standard shapefile format. But Bruce Ralston has just released a new tool called AFF Mapper that goes a step beyond his previous ones: it can convert TIGER shapefile data into KML format, link it to tabular American Fact Finder data (AFF) from the US Census, and plot this census data thematically. But unlike the previous TIGER tools, this one is a general-purpose one; it can convert any shapefile – point, line or polygon – into a thematic or unique value KML file, with the option of using thematic data from a linked external table. The only limitation is that the shapefile must be in geographic coordinates (lat/long), WGS84 datum, Google Earth’s native coordinate system.
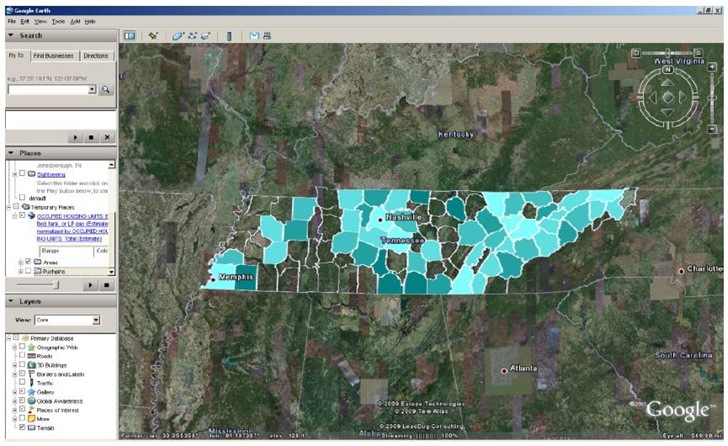
I won’t go through the process with Census data; there’s an excellent PDF manual that describes the process of creating maps like this one (from the manual):
But I’ll run through a sample general shapefile to KML conversion using this tool. I have an Arizona soils shapefile in lat/long/WGS84:
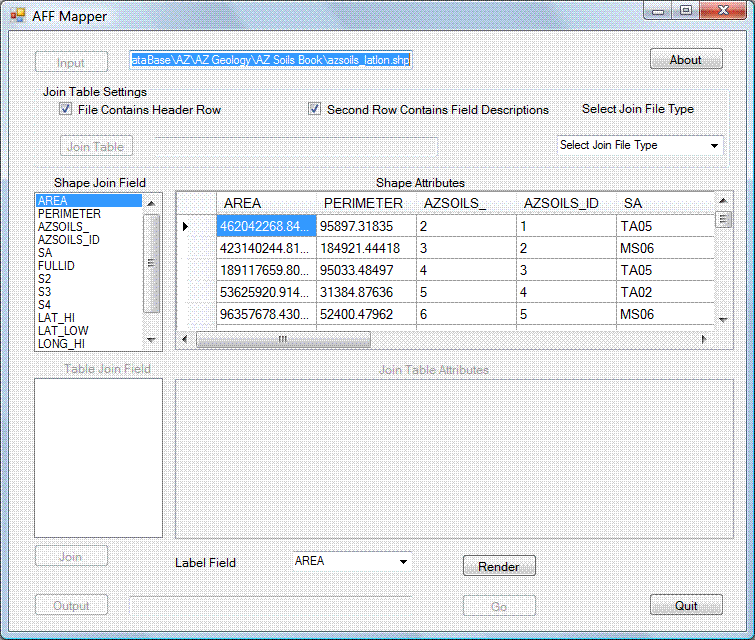
The shapefile’s attribute table is browseable, so I can select the desired attribute to plot by. I don’t have a separate data table to join, but you would use the boxes at left to select the common variable to use for joining the two sets of data. Click on Render to choose the attribute variable you want to plot:
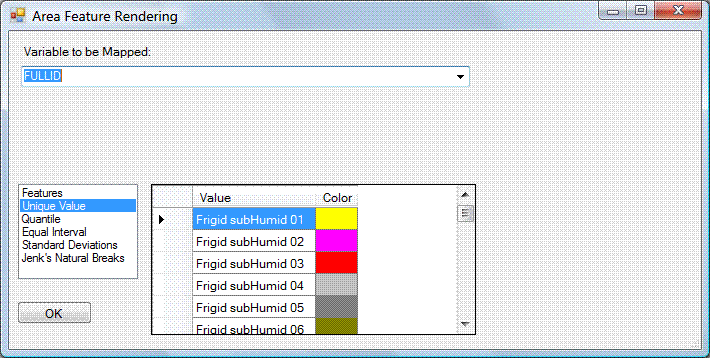
In this case, I’m plotting by a unique alphameric attribute value, but with numerical values, you could have color intervals corresponding to numerical intervals. Clicking on a color brings up a standard Windows color picker, so that you can set the colors to whatever you want (can’t save the settings, though).
After clicking OK, back in the main screen, you choose the output KML file name and location, as well as the label that will be assigned to push-pin centroids in the middle of each polygon. Once you do that, the “Go” button is enabled:

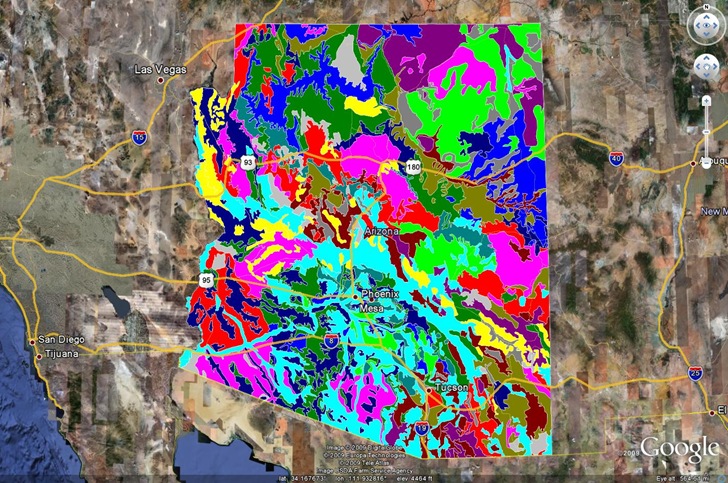
Click Go, and the KML file is created – the program is faster than any other shapefile to KML converter I’ve ever used. Open the file in Google Earth:
Click on the link in the Places pane for this file with the name of the label field (FULLID in this case), and a legend pops up on-screen in Google Earth:

There’s also a subfolder for the centroid pushpins; enable those and the view might get crowded:
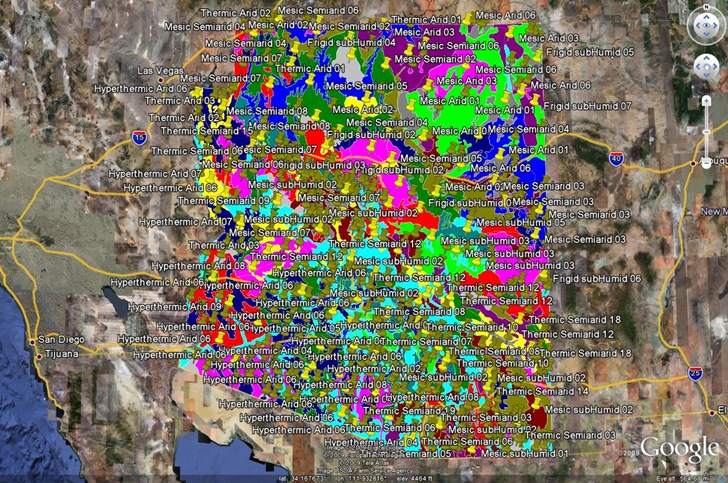
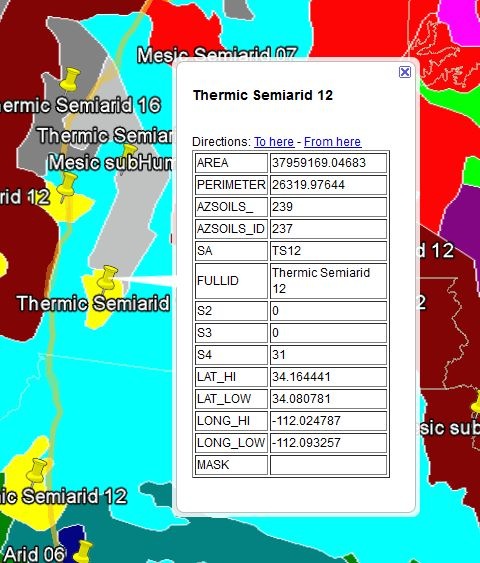
But they’re useful because if you click on one, you get the full attribute data set for that shape:
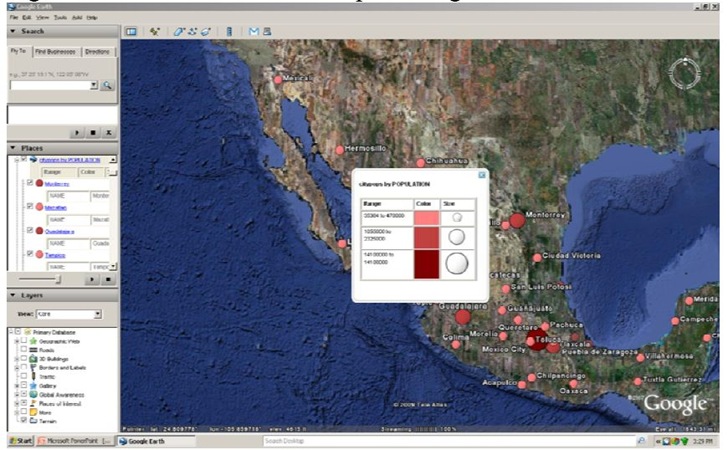
Here’s an example from the manual of a point shapefile plotting cities in Mexico, with size and color varying depending on population:
I’m not going to completely give up my previous free shapefile to KML converter, SHP2KML – it lets you use UTM shapefiles, does datum conversions, and has some formatting features that AFF Mapper doesn’t have, particularly for the pushpins. But for most applications, I think this is my new converter of choice.