An earlier post described how to use MicroDEM in conjunction with Trimble’s Planning Software to assess the effects of GPS satellite signal blockage by topography on GPS position error. But MicroDEM also has a built-in function that lets you calculate the times of day when the sun is blocked by the local terrain, and when it’s visible. Handy for photographers looking to shoot in sunlit conditions, campers who’d prefer shade early in the morning, and so on.
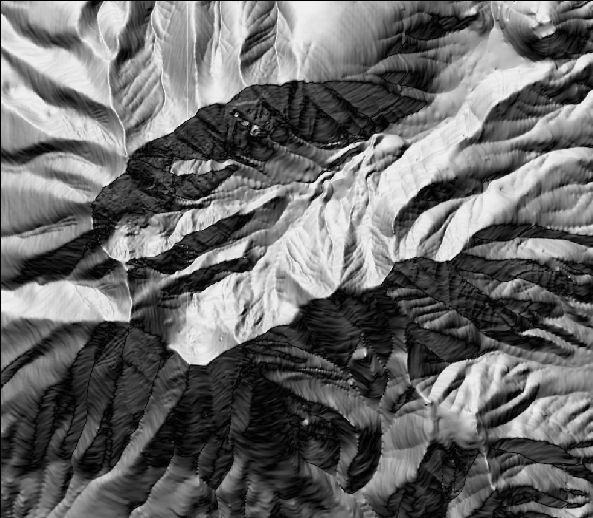
Back to my standard sample terrain DEM, displayed in reflectance mode in MicroDEM:
From the top menu in MicroDEM, select Calculate => Intervisibility => Sun above the horizon. Double-click on the map to select the location you want to assess. The Horizon Options window will come up:
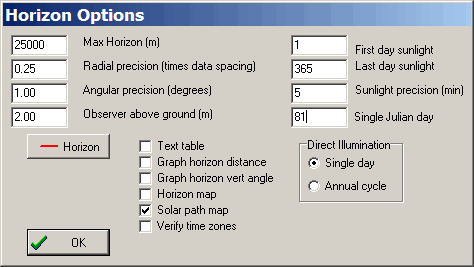
This is the same options window used to set parameters for “Horizon blocking” in the previous post. If you leave the first four boxes checked, you’ll get the same output as you would have selecting the “Horizon blocking” option in “Intervisibility”. But in this case, they’ll remain unchecked, since I’m only interested in the sun-related options, invoked by leaving the “Solar path map” box checked.
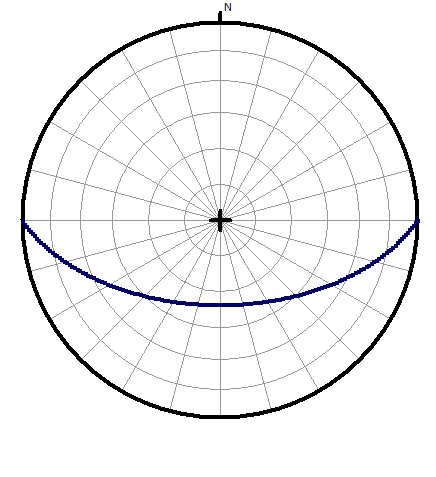
You have two choices for the kind of solar calculation done, each with somewhat different outputs. If you choose “Single day” under “Direct Illumination”, you will get results for only a single day of the year. The specific day is entered above in the “Single Julian day” box; Julian days are numbered from 1 for January 1st to 365 to January 31st. In the example above, day 81 is March 21st, around the time of the vernal equinox. You can also set the time resolution in minutes in the “Sunlight precision” box; you should set the variables at the left as described in the previous post. When you’re done, click on OK, and you’ll get a plot of the sun’s path across the sky on March 21st:
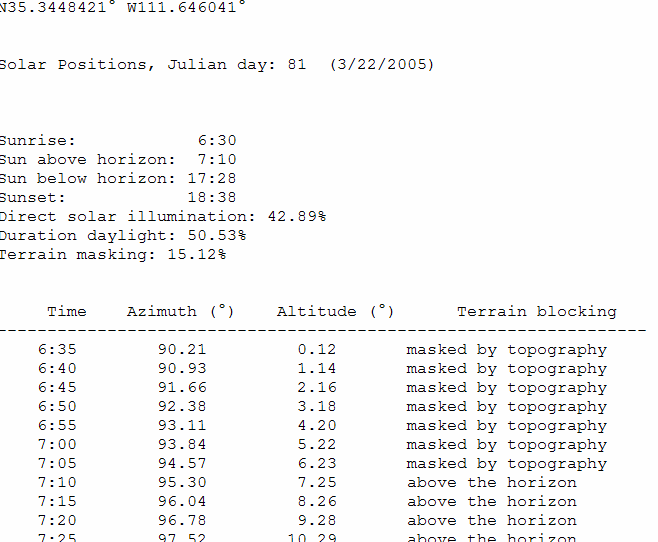
You’ll also get a table showing basic information about the location chosen (latitude/longitude, date, time of sunrise/sunset), and whether the sun is masked by topography or visible at various times of the day:
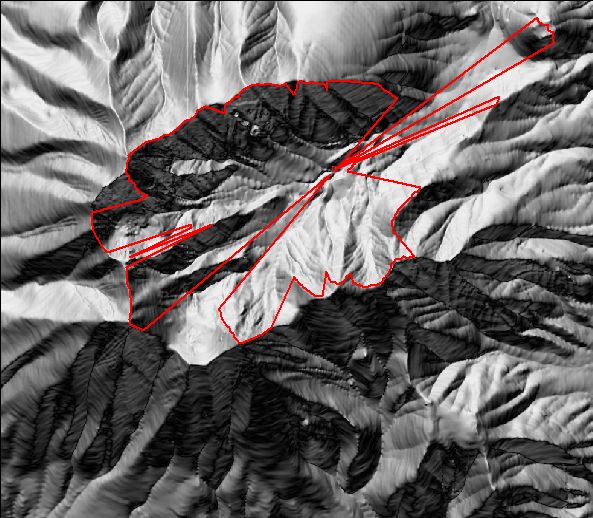
And the horizon blocking line will be drawn on the original terrain map, same as for the case of Horizon blocking:
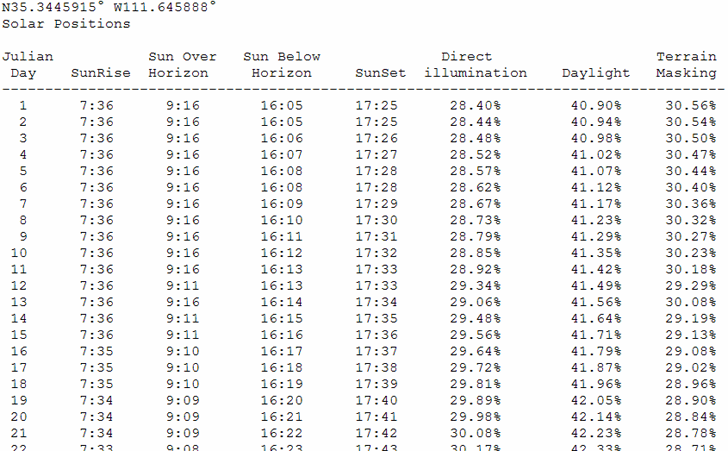
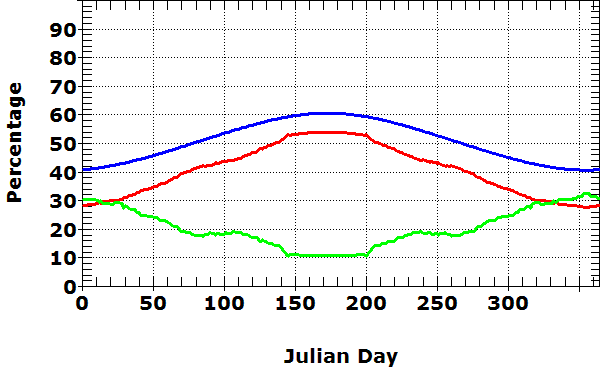
If you select “Annual cycle” in the Direct illumination section, you’ll get a table for the days between “First day sunlight” and “Last day sunlight” (1 and 365 in the example above) listing sunrise/sunset, when the sun appears above and disappears below the topographic horizon, and the percentages of the 24-hour day that the location receives sunlight, the sun is above the infinite horizon, and the percentage of the total daylight time that the sun is masked by terrain on that date.
And also a plot of the percentages above as a function of the day of the year:
There’s one other interesting solar option, but I’ll leave that for another post (tomorrow?).