In a previous post, MicroDEM was used to determine when the sun was visible from a particular location for any day of the year, including blockage by topography. But MicroDEM can also assess that data for a number of contiguous locations, determine for each of them how much sunlight they get during the day, and create a map of that total daily insolation. In a sense, it can create a solar “viewshed” map for a specific area. That might be of interest to solar energy enthusiasts, or those studying plant/animal microhabitats.
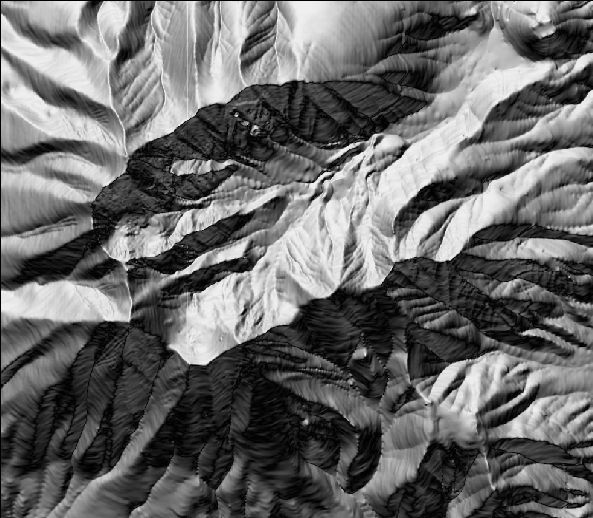
Back to MicroDEM, with my sample DEM loaded in reflectance terrain mode:

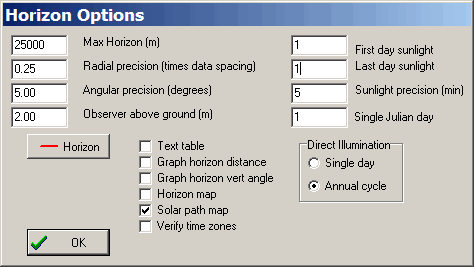
Select Calculate => Intervisibility => Create sunlight duration maps from the menu, and then click and drag on the map to draw a rectangular box around the area you’re interested in, NW corner to SE corner. The bigger the box you make, the longer it will take to do the calculations, and even with a small box it can take a while. Once the box is drawn, the Horizon Options window will come up:

Unlike the previous post featuring this window, this time the checkboxes are irrelevant. To set the day or days of the year you want to calculate this map for, enter the Julian day into the “First day sunlight” and “Last day sunlight” boxes. If you only want to do one day, make the first and last day numbers the same. If you want to do a series of days, enter the starting and stopping days of the series, but remember that if one day takes a long time, many days will take a lot more.
When you’re done, click on OK, and the program will ask you for the sampling increment. A value of “1” analyzes every point in the area, and created a continuous sunlight map, but takes the longest. Setting the sampling increment to a higher value will only calculate sunlight duration at that spacing on your DEM, creating a checkerboard pattern of data blocks and black missing data, but will also speed up the calculation. Click on OK, and depending on the number of days you’ve entered, the area size and the sampling increment, be prepared to wait; the progress will be shown on a program status bar window, and also as incrementing column/row numbers in the lower left corner of the program window. For a large area, a sample increment of 1, and a lot of days, the calculation will likely take hours, if not days.
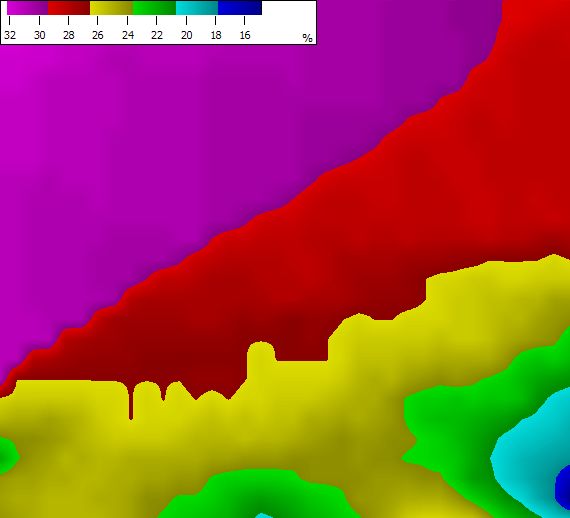
Once done, you’ll see … nothing; you have to open the generated data yourself. The maps are located in the c:/mapdata/sunlight folder as DEM files. Choose File => Open DEM, go to that folder, and select a DEM to open. They will be labeled by Julian day, i.e. January 1st will be called “jd 1.dem”, February 1st “jd 32.dem”, and so on. For the example below, the date was January 1st, and the sampling increment was 1:

The colors correspond to the percent of the total 24-hour day that area was in sunlight. In the example above, the lightest shade of purple corresponds to 32% of 24 hours = 7.68 hours of sunlight; the darkest shade of blue about 15% of 24 hours = 3.6 hours of sunlight.
please contact me. i am interested in finding out how much sun a particular house gets in the back yard.
i am thinking about purchasing the house, but am worried that there is too much shade in the back yard.
thanks
frank-