Broadly speaking, errors in the position a GPS receiver gives you are due to two factors: the precision with which the distance to each GPS satellite is known, and the geometry of the satellites, i.e. how closely or far apart they’re spaced across the sky. Distance errors can be compensated for by using WAAS, post-processing, averaging, and other techniques, but satellite geometry is a fundamental limiting factor. The maximum position accuracy you can achieve is limited by GPS satellite geometry.
The GPS satellite geometry factor is sometimes represented by a numerical measure known as “Dilution Of Precision”, or DOP. The higher the DOP, the greater the possible error in the accuracy of your position; roughly speaking, your total error is the error due to the uncertainty in satellite distance multiplied by the DOP. Professional-grade GPS receivers often come with software that will tell you what your current DOP is, tell you what it will be at some point in the future, and even prevent you from making a measurement when it’s too high. Consumer-grade GPS models don’t usually show you the DOP but instead show a general indicator of positional uncertainty, whose definition varies among different GPS unit manufacturers.
Two makers of high-end professional-grade GPS units, Magellan and Trimble, have made available free copies of software that can calculate GPS DOP as a function of date and time. The Magellan software is available on this website as part of the GPS Toolkit 0.11, which also installs several other programs. But I won’t talk about further, because IMO it’s not as good as Trimble’s Planning Software.
Download the Planning Software installation package from this page. You should also download a copy of the most recent Ephemeris file (almanac.alm) from the link on the same page (you may have to right-click on the link, and choose “Save Link As” or “Save Target As”, depending on your browser). The Ephemeris file contains the basic orbital parameters for all the GPS satellites, and these can change over time, albeit usually slowly. You will probably want to update this file every few weeks or so.
After installing the program, start up the Planning program, and get the following:

You can maximize this to fill your screen, of course. The first step is to load in and save the most recent Ephemeris file (almanac.alm). Choose Almanac => Load, and then go to the directory with the copy of the Ephemeris file you downloaded above to load it into the program. Once loaded, choose Almanac => Save to save that most recent almanac in the program directory, so that it will be loaded in automatically the next time you start up the program.
At the top are three checkboxes. “GPS” is for the US GPS satellite system, and should always be checked. “Glonass” is the Russian GPS system, which is currently being revived, but unless you have a receiver that is Glonass-capable (unlikely), you should uncheck that box. “WAAS” is for the Wide-Area Augmentation System satellites that broadcast correction signals that most modern GPS units can use to improve accuracy, and you can check that if you like. The position of these satellites doesn’t change in the sky, and they’re not used in calculating DOP, so this is optional.
Next, you need to set the location at which you plan to use your GPS. File => Station opens up the following window:
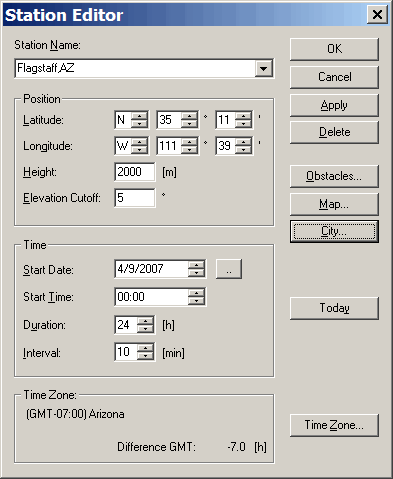
Here you can enter and save locations for where you will be making your observations from. Under Station Name, the drop-down menu will let you choose from previously-saved station locations. To create a station that is saved in this menu, you have three choices:
1. Type in the station name into the box at the top, enter the latitude, longitude, height above sea level (meters), and the elevation cutoff (the altitude below which a satellite is considered likely to be blocked by terrain). Once done, click on Apply, and the station will be saved and added to the menu.
2. Click on the Map button, and a map of the world will come up. As you move the cursor across the map, names of cities in a database will pop up. When you have the desired city selected, double-click on it, and its position will be entered in the Station Editor; click on Apply to save it in the list.
3. You can also select a city by clicking on the City button and choosing it from the menu, then clicking Apply to save it in the list.
The station position doesn’t have to be terribly accurate; being off by 15 miles will only change the altitude of a GPS satellite by about a quarter of a degree or so.
In the area below the position, you can set the date and starting time for when you plan to use your GPS to measure positions, as well as the duration and time resolution of the calculations. The “Today” button conveniently enters the current date into these boxes. The program doesn’t change this day as the actual date changes, so you’ll have to make sure it’s set correctly every time. And you should also set your “Time Zone” correctly using the button; set it to the Standard Time Zone for your area, and check the Daylight Savings Time box if your area uses DST.
Elevation Cutoff will exclude from the calculations all satellites below that altitude in the sky; the idea here is that you’re compensating for blockage of those satellites by local obstacles and terrain. There’s a related button called Obstacles, but I’ll get to that later …
Once you’ve setup your station position, and entered the correct date and times, click on OK. You can now plot satellite positions and calculate the Dilution Of Precision (DOP) for your selected location and date.
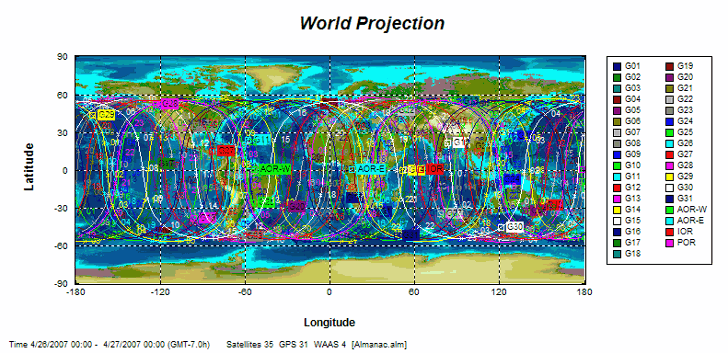
The GPS satellites are in a roughly 12-hour orbit around the earth; to see what areas the orbits will cover during the day, choose Graphs => World Projection (click on the image to enlarge it):
For the satellites visible from your area, start with Graphs => Elevation:
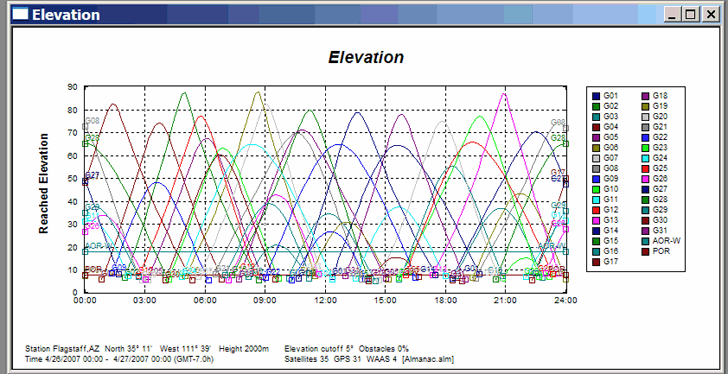
This shows the altitude of every GPS satellite in the sky on the date you’ve selected, as a function of time of day (military time). For Graphs => Number Of Satellites:
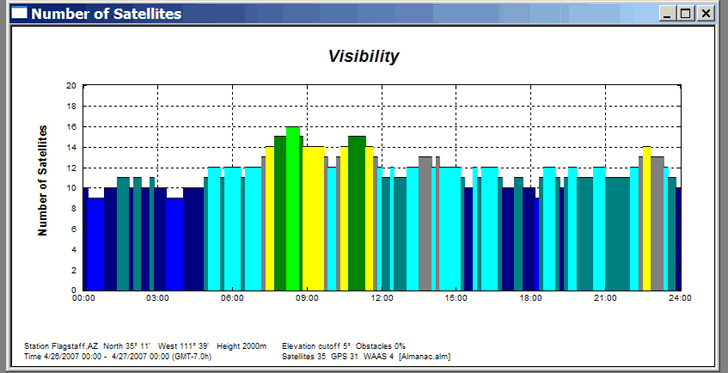
You get a bar graph showing how many GPS satellites are visible from your location, assuming that you have an unblocked view of the sky. Graphs => Sky Plot:
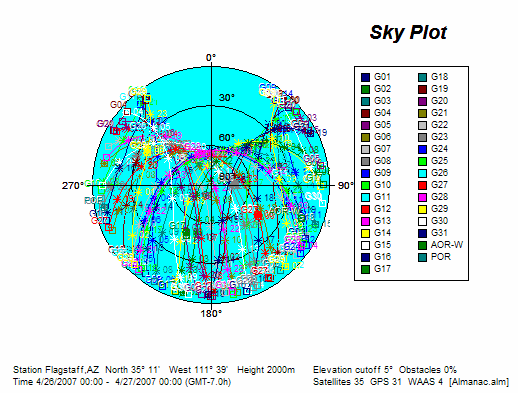
This shows the trajectory across the sky of every GPS satellite during the day.
All four of the above plots are a bit busy to be of use. But Graphs => Visible Satellites => GPS combines a lot of this data into a single plot:
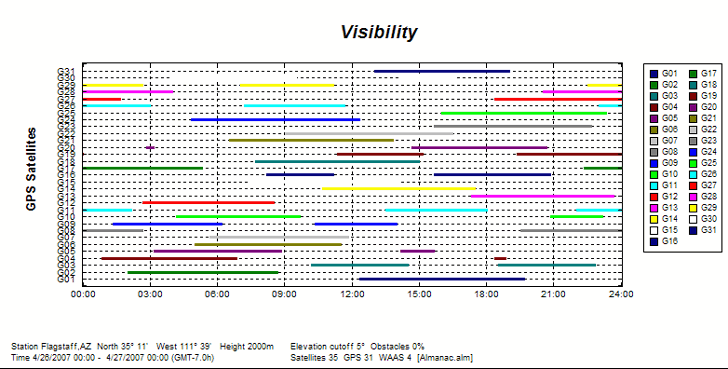
Each colored horizontal bar represents when a specific satellite is visible from your position. The satellite will be at its highest in the sky for a particular appearance at the time that corresponds to the center of the bar. To find out how many satellites are in the sky for a specific time, just count the number of colored bars above the time on the bottom axis of the graph.
But what you really need is the DOP, which takes into account both the number of satellites, and how widely they’re spread across the sky. There are actually 5 different types of DOP: Geometrical (including motion and 3D position), Position (3D position for a stationary observer), Horizontal (the 2D position, not including altitude), Vertical (altitude only), and Time. You can plot all of these separately using the Graphs => DOP => All Together:
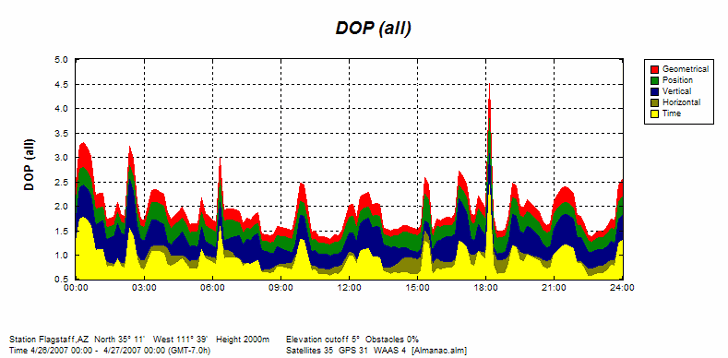
All of the DOPs move up and down together with each other. But usually you’ll be the most interested in the Positional or Horizontal DOP, since you’re usually determining a static position, and latitude/longitude is a 2-dimensional horizontal parameter:
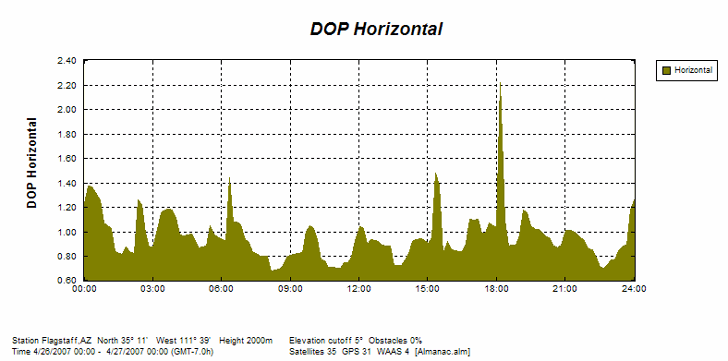
From this plot, you can see that there are several times during the day when the DOP is low, so you can achieve a lower uncertainty in your positional error. But there’s also a spike in DOP around 6 PM, so if you wanted to minimize potential position errors, you could avoid making a measurement at that time.
In addition to the graphic output, Planning Software can create text tables of satellite and DOP data, which appear in a helper application called HyperPage. HyperPage lets you print the list, or save it as an HTML file. The three options from the Lists menu are:
Intervals – A list in order of how many satellites are in the sky at one time, showing the number of satellites, the time period during which that number of satellites are in the sky, the Positional DOP during that period, and the actual satellite IDs. I find this of minimal practical use.
Elevation/Azimuth – Lists the actual position in the sky of the GPS satellites during the course of the day. Also of minimal practical use.
DOP Values – The most useful table. For every time of day, it gives you all five DOPs, plus the number of satellites in the sky. So you could look down this table, find the current time, and determine whether the DOP was low enough for you to get a high-quality measurement. Here’s an abridged sample of data from such a table:
| Time | GDOP | TDOP | PDOP | HDOP | VDOP | GPS | GLN | Total |
|---|---|---|---|---|---|---|---|---|
| 00:00 | 2.51 | 1.28 | 2.16 | 1.23 | 1.78 | 8 | 0 | 10 |
| 00:10 | 3.25 | 1.74 | 2.74 | 1.37 | 2.38 | 7 | 0 | 9 |
| 00:20 | 3.30 | 1.77 | 2.78 | 1.37 | 2.43 | 7 | 0 | 9 |
| 00:30 | 3.20 | 1.71 | 2.70 | 1.32 | 2.36 | 7 | 0 | 9 |
| 00:40 | 3.01 | 1.59 | 2.55 | 1.26 | 2.22 | 7 | 0 | 9 |
| 00:50 | 2.21 | 1.09 | 1.92 | 1.07 | 1.59 | 8 | 0 | 10 |
| 01:00 | 2.25 | 1.11 | 1.95 | 1.05 | 1.65 | 8 | 0 | 10 |
| 01:10 | 2.26 | 1.11 | 1.97 | 1.02 | 1.68 | 8 | 0 | 10 |
| 01:20 | 1.72 | 0.75 | 1.54 | 0.84 | 1.30 | 9 | 0 | 11 |
| 01:30 | 1.75 | 0.76 | 1.58 | 0.82 | 1.35 | 9 | 0 | 11 |
| 01:40 | 1.76 | 0.75 | 1.60 | 0.81 | 1.38 | 9 | 0 | 11 |
| 01:50 | 2.06 | 0.91 | 1.85 | 0.87 | 1.64 | 8 | 0 | 10 |
| 02:00 | 1.81 | 0.75 | 1.65 | 0.82 | 1.43 | 9 | 0 | 11 |
| 02:10 | 1.79 | 0.73 | 1.64 | 0.82 | 1.41 | 9 | 0 | 11 |
| 02:20 | 3.22 | 1.53 | 2.83 | 1.25 | 2.54 | 8 | 0 | 10 |
| 02:30 | 2.95 | 1.40 | 2.60 | 1.22 | 2.30 | 8 | 0 | 10 |
| 02:40 | 2.09 | 0.91 | 1.89 | 0.99 | 1.61 | 9 | 0 | 11 |
| 02:50 | 1.73 | 0.71 | 1.58 | 0.87 | 1.32 | 8 | 0 | 10 |
| 03:00 | 1.70 | 0.70 | 1.55 | 0.88 | 1.28 | 8 | 0 | 10 |
| 03:10 | 2.01 | 0.87 | 1.81 | 1.02 | 1.50 | 8 | 0 | 10 |
| 03:20 | 2.32 | 1.06 | 2.07 | 1.15 | 1.71 | 7 | 0 | 9 |
| 03:30 | 2.33 | 1.07 | 2.07 | 1.17 | 1.70 | 7 | 0 | 9 |
| 03:40 | 2.30 | 1.06 | 2.04 | 1.18 | 1.67 | 7 | 0 | 9 |
| 03:50 | 2.25 | 1.04 | 1.99 | 1.17 | 1.61 | 7 | 0 | 9 |
| 04:00 | 1.85 | 0.79 | 1.68 | 1.11 | 1.25 | 8 | 0 | 10 |
| 04:10 | 1.72 | 0.76 | 1.55 | 0.97 | 1.21 | 8 | 0 | 10 |
| 04:20 | 1.80 | 0.81 | 1.61 | 0.96 | 1.29 | 8 | 0 | 10 |
| 04:30 | 1.89 | 0.86 | 1.68 | 0.97 | 1.37 | 8 | 0 | 10 |
| 04:40 | 1.98 | 0.92 | 1.76 | 0.98 | 1.46 | 8 | 0 | 10 |
| 04:50 | 1.82 | 0.81 | 1.63 | 0.93 | 1.34 | 9 | 0 | 11 |
| 05:00 | 1.61 | 0.70 | 1.45 | 0.87 | 1.16 | 10 | 0 | 12 |
| 05:10 | 1.63 | 0.71 | 1.46 | 0.87 | 1.17 | 10 | 0 | 12 |
| 05:20 | 1.63 | 0.72 | 1.46 | 0.88 | 1.16 | 10 | 0 | 12 |
| 05:30 | 2.17 | 1.11 | 1.87 | 1.05 | 1.55 | 9 | 0 | 11 |
| 05:40 | 1.85 | 0.92 | 1.60 | 0.97 | 1.27 | 10 | 0 | 12 |
| 05:50 | 1.78 | 0.88 | 1.55 | 0.95 | 1.22 | 10 | 0 | 12 |
| 06:00 | 1.71 | 0.83 | 1.50 | 0.93 | 1.17 | 10 | 0 | 12 |
| 06:10 | 1.65 | 0.79 | 1.45 | 0.92 | 1.12 | 10 | 0 | 12 |
| 06:20 | 2.98 | 1.57 | 2.53 | 1.44 | 2.08 | 9 | 0 | 11 |
| 06:30 | 1.90 | 0.91 | 1.66 | 1.08 | 1.27 | 10 | 0 | 12 |
| 06:40 | 1.94 | 0.93 | 1.70 | 1.08 | 1.32 | 10 | 0 | 12 |
| 06:50 | 1.94 | 0.93 | 1.71 | 1.05 | 1.34 | 10 | 0 | 12 |
| 07:00 | 1.91 | 0.94 | 1.67 | 0.93 | 1.38 | 10 | 0 | 12 |
| 07:10 | 1.88 | 0.90 | 1.65 | 0.91 | 1.38 | 11 | 0 | 13 |
| 07:20 | 1.63 | 0.76 | 1.45 | 0.83 | 1.19 | 12 | 0 | 14 |
| 07:30 | 1.74 | 0.82 | 1.54 | 0.82 | 1.30 | 12 | 0 | 14 |
| 07:40 | 1.71 | 0.80 | 1.51 | 0.79 | 1.29 | 13 | 0 | 15 |
… and so on.
There is, of course, a problem with this data; it doesn’t completely take into account the fact that your view of some of the satellites might be obstructed, either by small but nearby obstacles like houses, trees, or rocks, or bigger obstacles like the local terrain. As more and more satellites are blocked from view, the DOP will usually increase. Setting some angular value for the elevation cutoff can partially account for these kind of obstacles, but that’s a very coarse and inaccurate solution in most cases.
There’s not much you can do to account for nearby obstacles, but in a post tomorrow, I’ll show a way to account for terrain blockage of GPS satellite signals on the DOP.

