Yesterday’s post dealt with Trimble’s Planning Software, which lets you calculate a GPS-satellite-geometry-dependent error parameter called “Dilution Of Precision”, DOP for short. The calculated DOP can tell you when the GPS satellite geometry is favorable (or unfavorable) for reducing errors due to GPS satellite geometry. But those calculations assumed that you had an unobstructed view of the entire sky, and had line-of-sight to every GPS satellite above the horizon. In many cases, though, your view of GPS satellites is likely to be obscured, either by local obstacles like buildings and vegetation or more distant ones like topography. There’s not much you can do about taking the former into account, but there is a way to deal with the latter to some degree.
In the Station Editor for Trimble’s GPS Planning Software, there’s a button marked “Obstacles …”. Click on it, and the Obstruction Editor comes up:
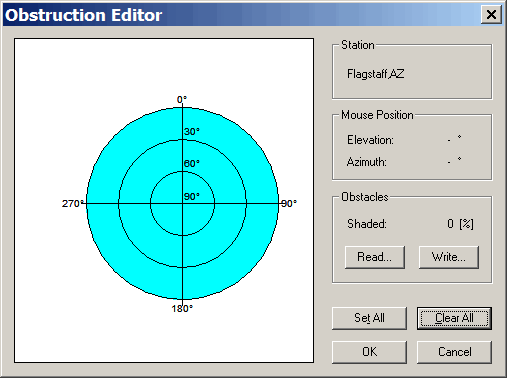
With your mouse, you can draw in obstacles that are present along the horizon at the location you want to do your GPS measurements. These would usually be the local terrain, but you could also draw in closer obstacles like houses and trees if you’re familiar with them. But if you’re planning measurements at a distant location, you won’t know what the closer obstacles are going to be, and drawing the terrain may be a matter of guesswork, based on reading topographic maps of the area. But it doesn’t have to be; there’s a way to determine the horizon blockage due to the local terrain.
First, fire up your copy of MicroDEM, and open up a DEM (digital elevation model) of the terrain where you’ll be performing your GPS measurements, perhaps one you’ve downloaded from the USGS Seamless Server. Here’s the one I’ve been using in most of my MicroDEM posts:
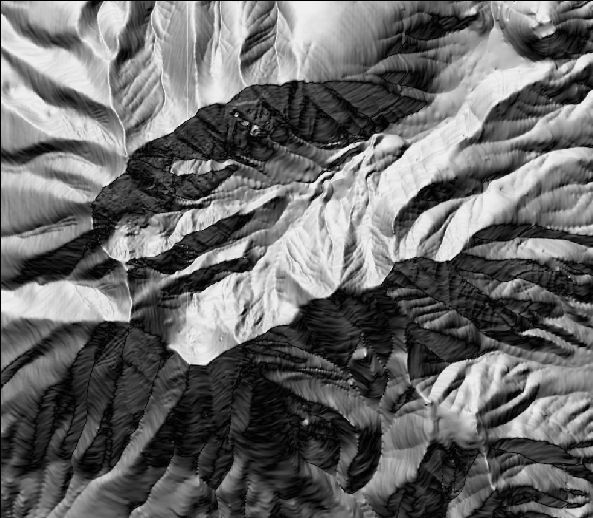
Suppose there’s a general location on this map where I would like to do GPS measurements with as small an error as possible, say N35.344, W111.646. Since the DEM allows you to create a virtual model of the terrain as seen from that point, MicroDEM has the ability to determine what parts of the sky are visible from that location, and which ones are blocked by the terrain.
First, from the menu, select Calculate => Intervisibility => Horizon blocking. Next, double-click on the map at the location you plan to do your GPS measurements. The Horizon Options window will appear:
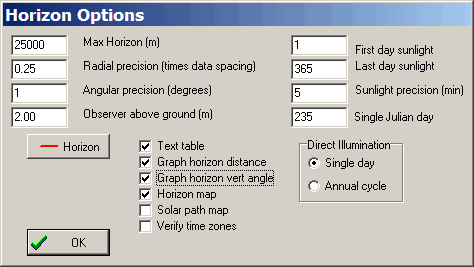
Here you set:
- Max Horizon: How far out you can see, in meters. If this distance extends further than the edge of the DEM, it will stop there.
- Radial precision: Resolution for the drawing of the radial distances from your position out to the horizon. Smaller is more precise, but takes more time.
- Angular precision: The angular spacing between successive radials. For this application, you need to set it to 1 degree.
- Observer above ground: How far above the ground you are looking, or in this case, how far above the ground you’ll be holding the GPS unit or its antenna.
- Horizon: Lets you set the color and thickness for the horizon blocking line.
The check boxes select the output types; only the Horizon map and Text table are really needed, but I’ll leave the two Graphs checked as well. You don’t need to have the bottom two checked, and you can also ignore the other inputs (sunlight, Julian day, etc.; I’ll talk about these in an upcoming post). Once done, click on the OK box.
On the original map, the horizon blocking line will be drawn marking the furthest point you can see in that direction (the small red box marks the observer’s position):
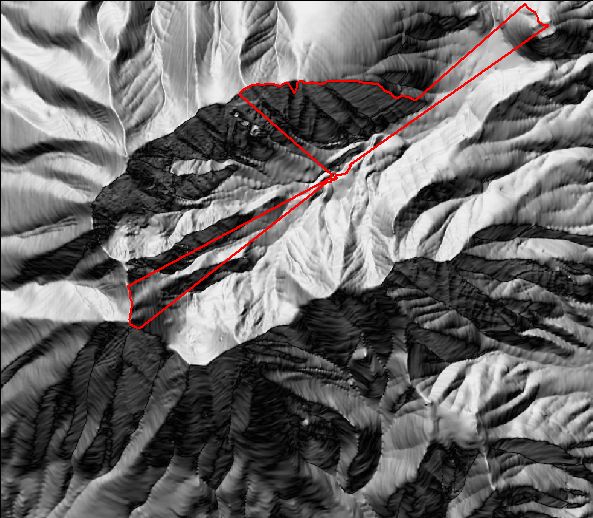
To get rid of this line, click on the “Redraw map” button on the map toolbar (the clockwise blue arrow).
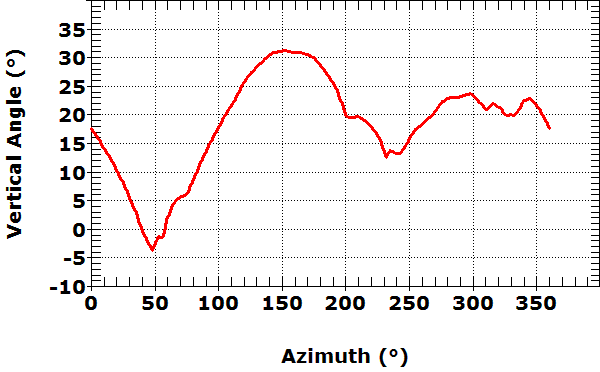
One graph window will show the horizon blocking angle (altitude) as a function of direction (azimuth):
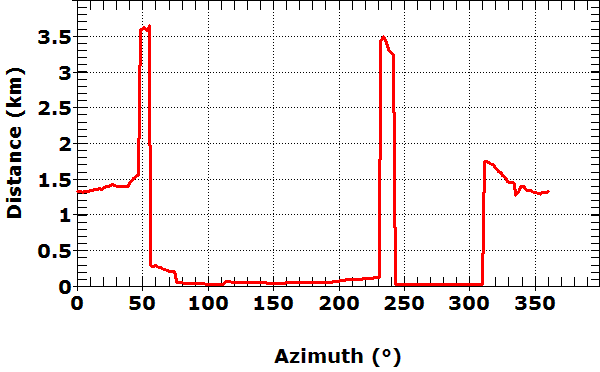
Another graph window will show the distance to the topographic horizon from the observer’s position as a function of direction:
The final graph window has an angular plot showing the topographic horizon plotted around the 360 degrees of a circle:
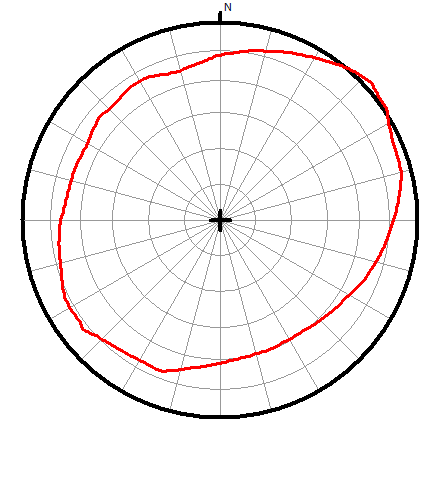
Compare this with the Obstruction Editor in the Trimble Planning Software (the first graphic in this post), and you’ll see that this is the sky blocking information that needs to be entered there. You could use the plot above as a guide, and try and copy it by hand into the Obstruction Editor, but you don’t have to. The Obstruction Editor has the ability to read in a text file with direction angles and altitude angles, and fill in the terrain blocking automatically, and MicroDEM generates this for you automatically.
There are two other data windows created by MicroDEM that have text data in them. One is a labeled table, with azimuth, horizon angle and blocking distance:
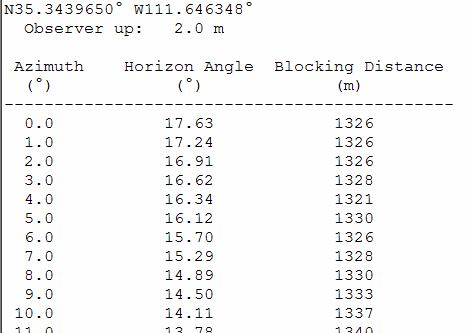
This data is not in the correct format for the Obstruction Editor. But there’s a second text window that opens as well:
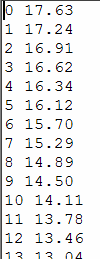
Professor Peter Guth, the author of MicroDEM, was good enough to add this text output window, which has the azimuth and horizon angle in an acceptable format for the Obstruction Editor. Click on the icon at the upper left of the window, the “Save file” icon, and you can save this text data in *.txt format.
Now go back to the Trimble Planning Software, open up the Station Editor, and enter the location you used in MicroDEM. Click on Obstacles to open the Obstruction Editor, click on the “Read” button, and open the text file that you saved in MicroDEM with the azimuth and horizon angle data. It should now look something like this:
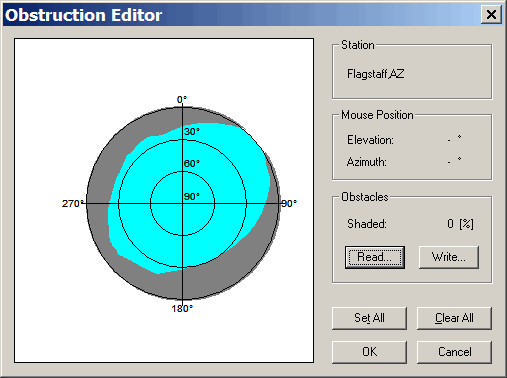
The part of the sky blocked by the terrain is filled in. Click on OK, and you’re now ready to calculate an accurate GPS DOP for this location.
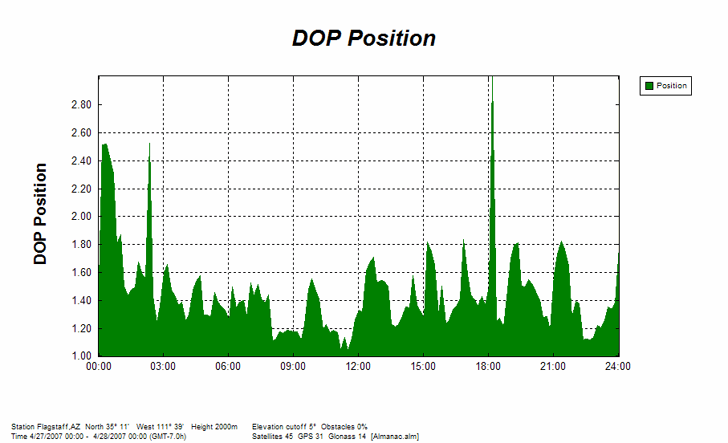
If there were no terrain blocking the sky in this location, the Position DOP graph would look like this:
But with the terrain blocking taken into account, the actual DOP for this location looks like this:
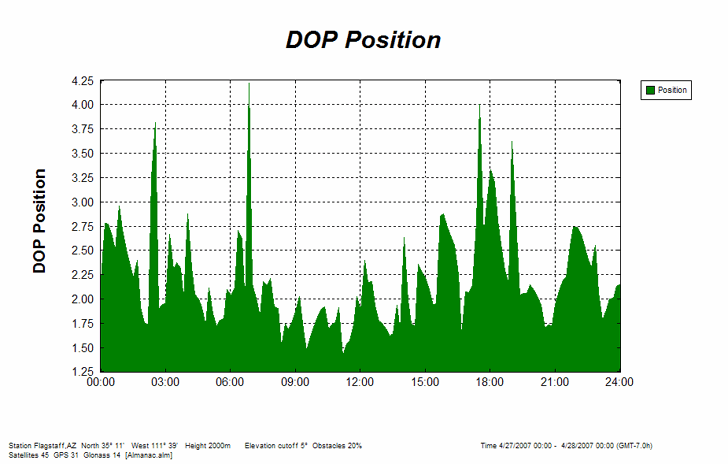
Notice that the DOP is higher in general in this second plot, which you would expect – you’re seeing fewer GPS satellites, and that limits the geometric accuracy. But there are also fewer times when the DOP is low, and new spikes in the DOP that represent times when the potential GPS error will be larger. You might want to consider scheduling your GPS measurements at this location for times when the DOP is low, or if you have no choice on scheduling, avoiding those times when the DOP spikes to higher levels.

