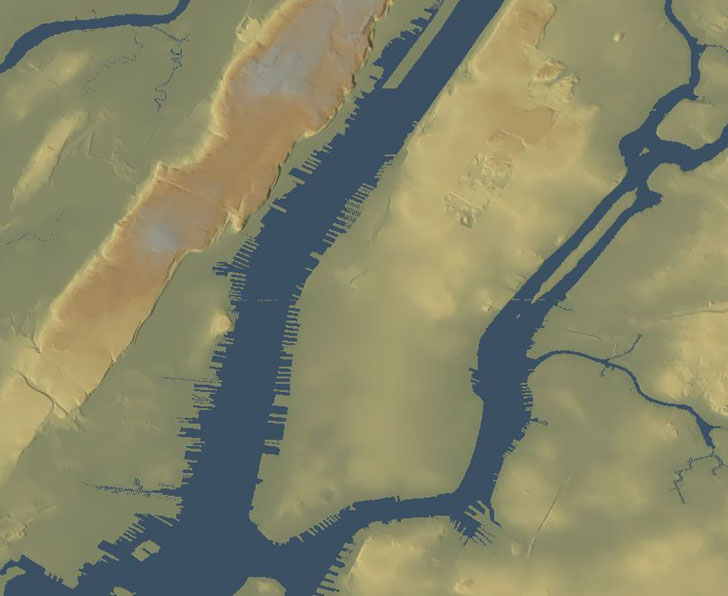
A while back, I did a post on assessing the effects of sea level rise on coastlines using the program 3DEM. Here’s a terrain image of southern Manhattan Island at current sea level:
And here’s what it would look like with 8 meters of flooding, due either to a hurricane storm surge or global-warming-induced sea level rise:
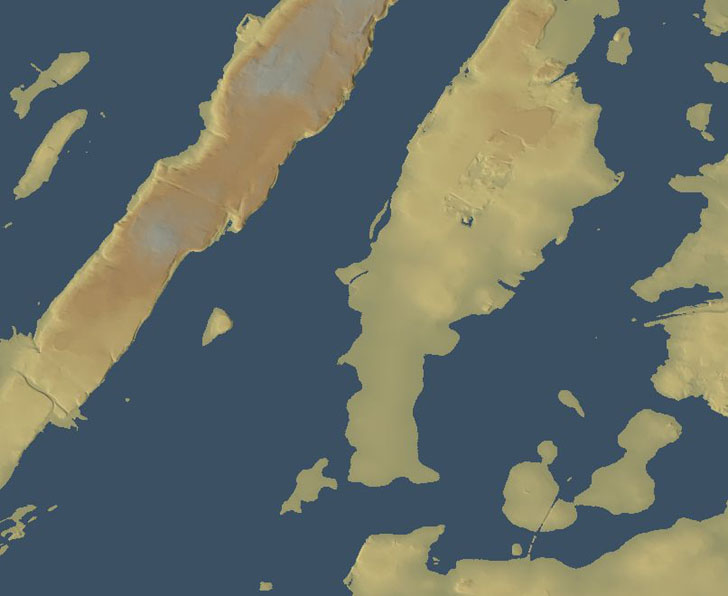
The problem with the latter image is that 3DEM did a basin flood, i.e. it filled in all the terrain that was less than 8 meters below sea level, without taking topography into account. For example, a range of hills could lie between some lowlands and the sea, but 3DEM wouldn’t take that natural dam into account. But I also posted an animated flooding map of the same area that did take that terrain blocking into account (click on the “play” button to view the animation):
Today’s post will show how to create such a flooding animation.
The flooding simulation and animation is created using the program MicroDEM, which I’ve been posting about ad nauseam on this blog. Even so, I’ve barely scratched the surface of what it can do, this flooding simulation being the latest example of that.The first thing you’ll need is a digital elevation model (DEM) of the area you’re interested in, which you can get from the USGS Seamless Server website. Below is one from there for the area around Norfolk – Newport News, Virginia, shown in gray reflectance mode with 5x terrain exaggeration:
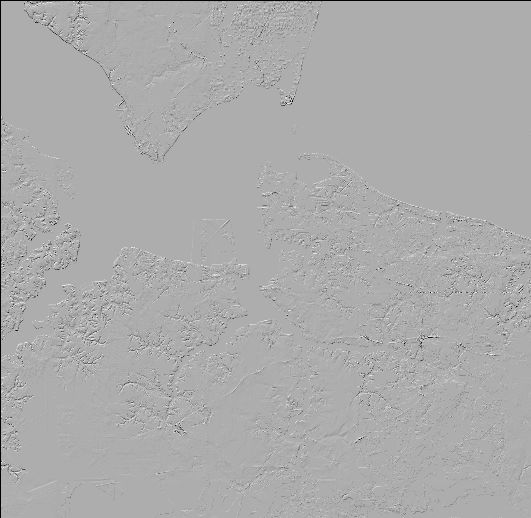
The problem is, the terrain relief is so small in this area that even exaggerating it by a factor of 5 doesn’t show much detail. But by right-clicking on the map, selecting “Reflectance options” from the drop-down menu, and choosing “Blue/Green” for the colors, one gets:
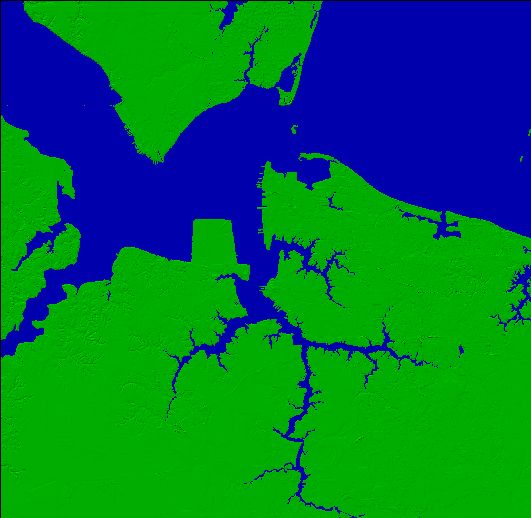
MicroDEM tints all elevations at 0 meters (aka sea level) blue, and all higher elevations (land) as green, making the terrain easier to identify. From the menu at top, choose Calculate => Drainage => Flood Basin, then double-click on the map at the spot where you want to set as the base elevation level for the flood basin. In this case, you can click on any point tinted blue, which is at sea level. You then get the Flooding Form:
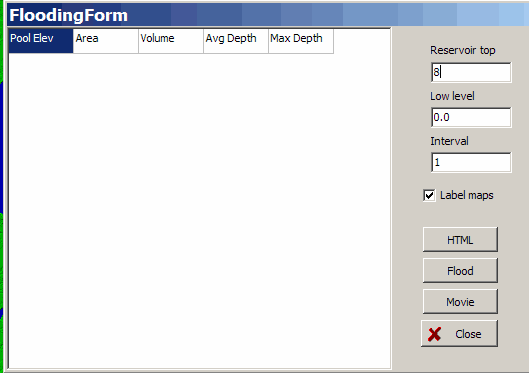
Here, you set the “Reservoir top” (the height you want to flood to), “Low level” (the height you’re flooding from), and the flooding interval (the step increase in flood level if you’re creating a movie; if you’re creating a still image, this level is ignored). The “Label maps” checkbox sets whether the resulting map or movie is labeled with the flooding level. The four buttons at the lower right are:
Close – Cancels the operation
HTML – I believe this outputs the flooding data as an HTML file, though I’m having difficulty figuring that out.
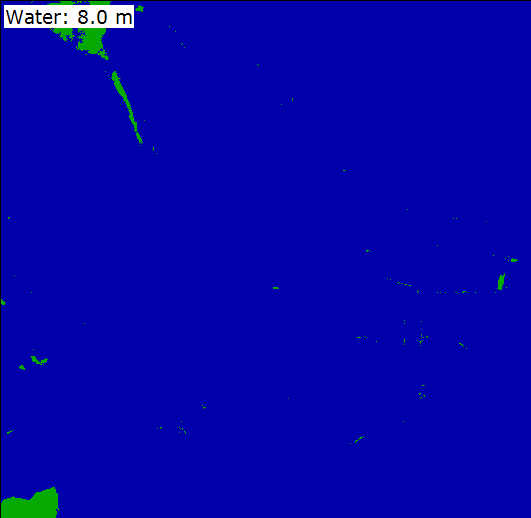
Flood – Floods the current DEM to the reservoir top only, and creates a static image for the results. For the settings above (a reservoir top of 8 meters), the following image is created:
Movie – Floods the DEM by the set increment, and creates a movie of the results (see this post for more info on the movie player and movie export functions of MicroDEM).
Flooding the DEM above with an increment of .05 meters, you get the following movie:
This is true basin flooding, with topography controlling how the flooding takes place. If a big hurricane with an 8-meter storm surge hits this area, a lot of the land area will be underwater. You’re not just limited to seacoast flooding, nor to flooding on DEM reflectance terrain maps.
For the second example, I’m going to use a DEM for the Pittsburgh area, near the Three Rivers junction. Here I’ve gone back to a gray reflectance mode display of the DEM:
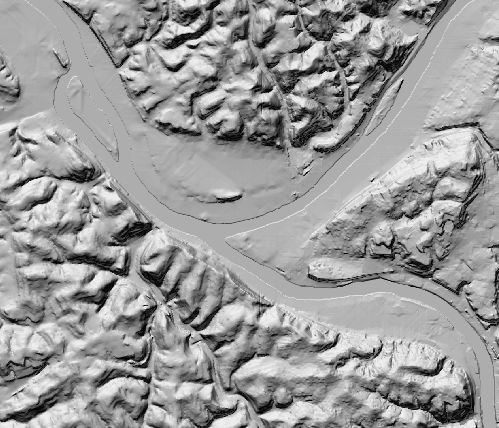
I’ll also load in a 100K scale USGS topo map of the same area from the USGS Seamless Server:
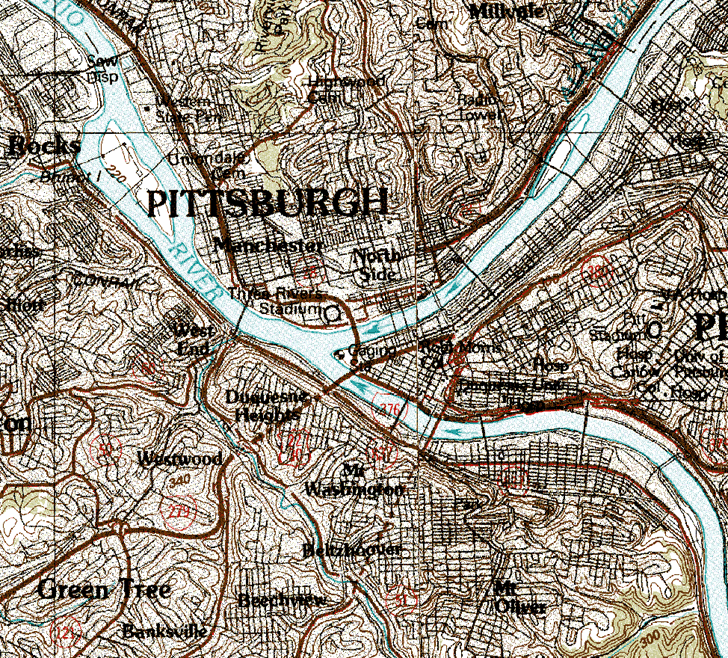
The DEM and map are linked together by MicroDEM, so that you can perform many of the same operations on the graphic image as you can on the DEM, in this case flooding. In 1936, the St. Patrick’s Day flood raised river levels in Pittsburgh by 46 feet, about 14 meters, so I’ll flood the map to that level. Selecting Calculate => Drainage => Flood Basin from the menu, and double-clicking on a spot on the river in the topo map, the FloodingForm comes up:
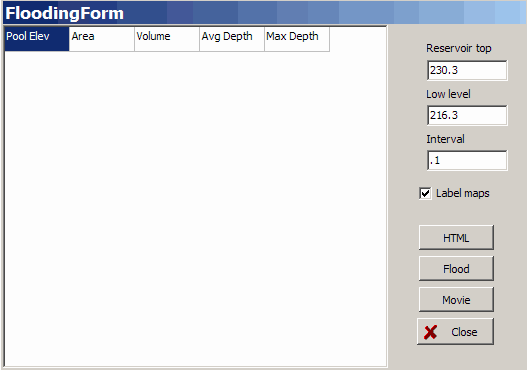
The elevation where I double-clicked, on the river, is automatically entered into the “Low level” (216.3 meters); by adding 14 meters to that number, I get the Reservoir top I want of 230.3, and entered that manually into the form. Clicking on “Flood” gives me the following flood image of the topo map:

Blue represents the area covered by water; the topo map has been converted to grayscale so that you can see the water more easily.
You can also create a flooding movie on a graphic image as well In the example below, I’ve done that for the Pittsburgh area using a black-and-white aerial photo:
Is this completely realistic? No, there are limitations due to the data and the approach. The DEM has a 10-meter resolution, so if there are thin floodwalls or barriers along the oceanside or riverside, they may not be fully taken into account when creating these flooding scenarios. And the DEM has a limited coverage area; if there’s a conduit for water “off-screen”, the program won’t know that, and will view the edges of the DEM as an unsurmountable obstacle. And for river flooding, there’s a gradient since the river flows downhill, and this simulation doesn’t take those effects into account. So you shouldn’t necessarily treat these results as gospel truth; for that, you’ll have to buy COTS software, probably at a very high price. To a first approximation, MicroDEM can give you a feeling for how much flooding might take place if the water rises, and at an unbeatable price.
Nice article Leszek! Too bad there wasn’t a Google Earth file from this, or I would write about it at GEB.
I’d like to know why you used 8 meters for your analysis.
8 meters of sea level rise would take 8,000 years using global average sea level rise (10 cm / century), and 2,600+ years in the Chesapeake region (.21 cm/year land subsidence + global sea level rise). Of course we would expect large changes in sea level over time scales that long; sea level was ~120 meters lower at the peak of the Wisconsin Ice Age ~15,000 years ago.
ForestRanger,
The posting talks about flooding from a variety of causes, including storm surge. 8 meters is roughly the level of the record storm surges estimated for Katrina, though they don’t know for sure because many of the tidal gauges were destroyed. See this NOAA article for more info.
I don’t know where you got the 10 cm/century figure for sea level rise, but it’s not correct. Measured rates of sea level rise using the TOPEX satellites indicate a rate of about 2-3 mm/year, and as the earth gets warmer, this rate is expected to accelerate by as much as 2-5 times due to the time lag between the atmosphere warming and the deep oceans. The most recent IPCC report on climate change puts the maximum sea level rise by 2100 at about 80 cm. But this report has been criticized because it hasn’t taken the latest data on sea level rise factors into account, like increased melting rates and ice flow in both Greenland and Antarctica. Over the past 50 years, predictions of future sea level rise have always underestimated the actual numbers.
Then there are the very low probability events, like the melting of the entire Greenland ice cap (which adds about 6.5 meters), and the collapse of the west Antarctic ice shelf (another 6 meters or so). These are highly unlikely, but not impossible; combine these with the factors mentioned above, and 8 meters actually looks pretty good. Of course, then you get to add an additional possible 8 meters of rise from a storm surge on top of that. Global warming may (or may not) increase the intensity and number of hurricanes.
Hey there; really fascinating program, I wondered if you could help me. I’m doing research for a book about possible cataclysmic world flood scenarios, and I’ve been looking for some information on possible topography changes etc. I have found http://merkel.zoneo.net/Topo/Applet/ which was helpful but not detailed enough, just wondering if you had any idea where to look if I wanted to find out what the earth would look like with a sea-level rise of more than 2,000 meters? Anything at all would be helpful, thank you.