blankblank blank


Archive for the 'cartography' Category Page 7 of 14


Map Folding

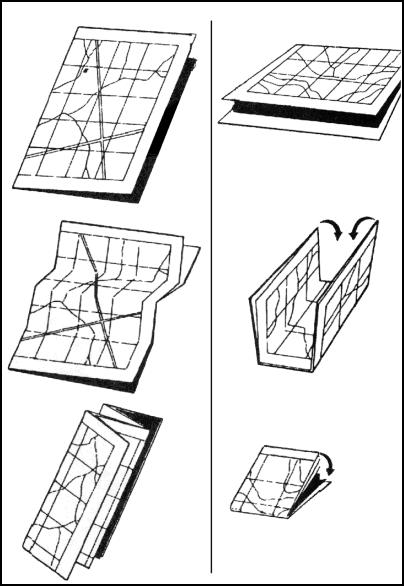
If you still do old-school navigation with map and compass, the US Army’s Field Manual on Map Reading And Navigation is an excellent resource. You can buy a copy if you like, but there’s an HTML version here, Google Books has it available in poor quality scanned form here, and you can view/download a PDF copy from Scribd here (book is in the public domain).  In one of the appendices, it has diagrams showing three different ways to fold a map so that you can view parts of it without completely unfolding it. The first two are self-explanatory:

fold1

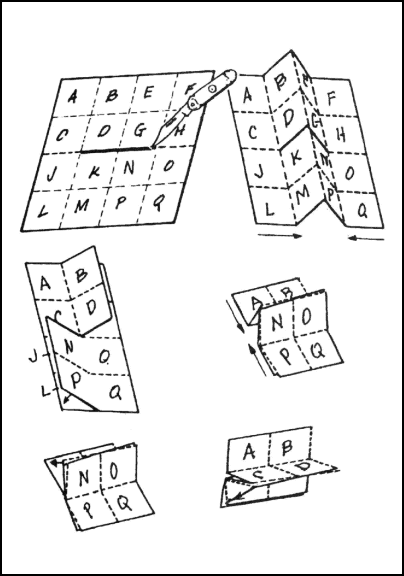
The third one, the “Protection Method”, is a nifty way to fold a map so that it takes up 1/4 of its original size so that you can paste it into a notebook, but still have all sections of it accessible for viewing:

fold2

Had to try it out to figure out what was going on. After you’ve completed the full set of folds, adhere the undersides of sections A, F, L and Q to your notebook page. You can then view the various quadrants (A-D, E-H, J-M and N-Q) by flipping the sheets over the horizontal and vertical folds that cross the quadrants. Try it with a scrap piece of paper first :).

If you have a square map and want to try something different, you might try the Turkish Map Fold; I couldn’t quite figure it out myself.


GUI For Generic Mapping Tools (GMT) Plus Added Geophysics Tools

The Generic Mapping Tools (GMT) is a collection of 60-odd command line tools for manipulating gridded and vector data, and creating high-quality output in EPS (Encapsulated PostScript) format. Working with it in command-line format isn’t the most user-friendly experience. Mirone offers a far-more accessible GUI interface to GMT’s features, and adds a few geophysics-related capabilities of its own:

  • Multibeam mission planning
  • Elastic deformation studies
  • Tsunami propagation modeling
  • Earth magnetic field computations and magnetic Parker inversions
  • Euler rotations and poles computations
  • Plate tectonic reconstructions
  • Seismicity and focal mechanism plotting

If you have MatLab installed on your system, there are source code versions available for Windows, Mac and Linux. If not, there’s a stand-alone executable for Windows systems that runs slower than the MatLab version.

Other graphical front-ends for parts of GMT include iGMT (requires Tcl/Tck), Win4GMT, and SeaTree.


Online Articles From “The Map Collector”

Published between 1977 and 1996, “The Map Collector” published articles on the history and lore of maps and mapmakers. Kunstpedia, the “knowledge base on fine- and applied arts, popularly stated arts and antiques”, has gotten permission to put articles from Map Collector online, with more articles going up on a regular basis in either HTML or PDF format. There’s a wide range of articles, like:

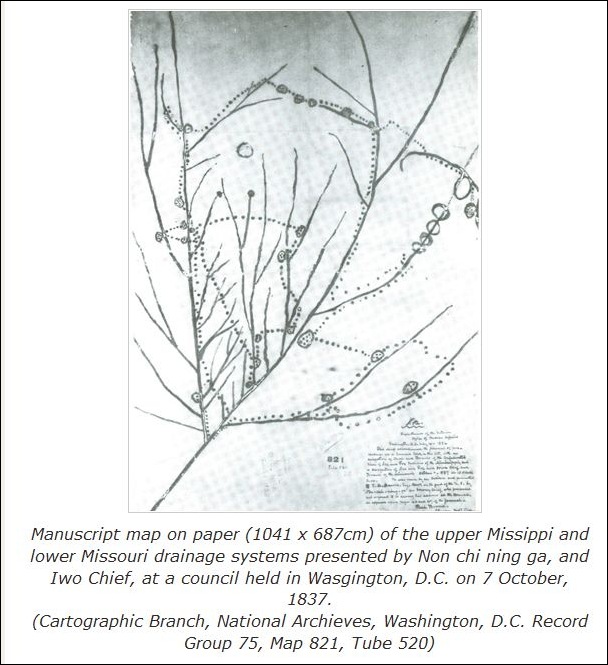
The Indigenous Maps And Mapping Of Native Americans

nativemap

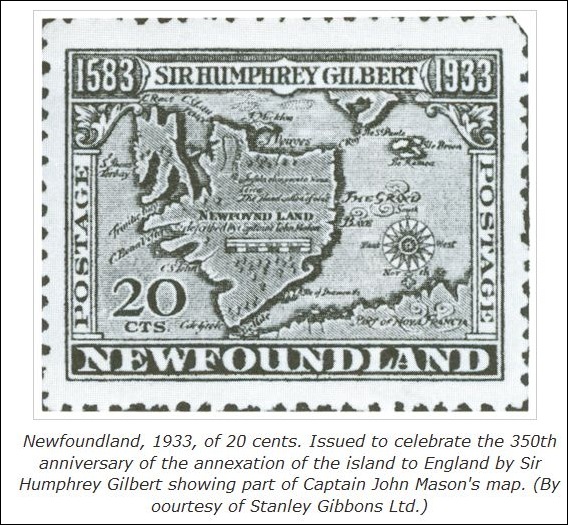
Collecting Maps On Stamps

stamps

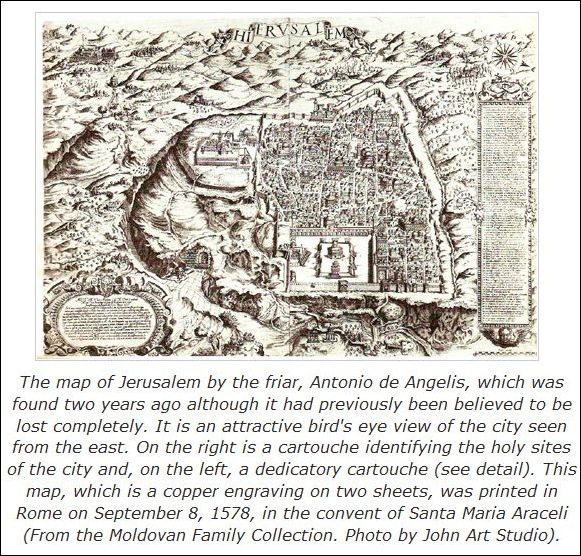
The Lost De Angelis Map Of Jerusalem, 1578

jerusalem

To browse all the articles, find the navigation bar on the home page:

mapcolnav

and click through all the pages.

Via Making Maps.


Convert Shapefiles Into SVG Format With Thematic Coloring

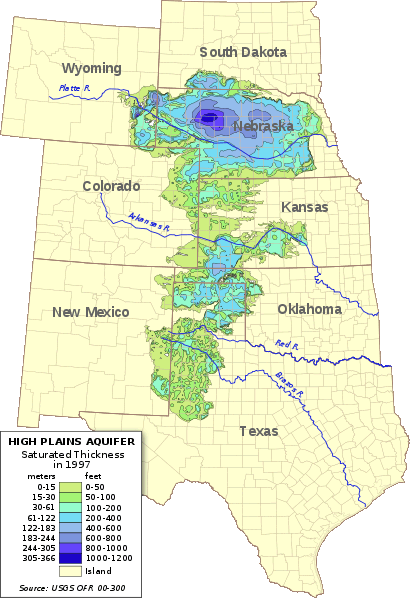
Not too long ago, I covered an online application from indiemapper that converts shapefiles into SVG format, a standard format for vector illustration programs like Adobe Illustrator or the open source Inkscape. One drawback of that site was the inability to color/shade the SVG output based on shapefile attribute data. Ken Hardy has a Perl utility called shptosvg that will take shapefiles and convert them into SVG format, and includes the ability to color files based on their attributes:

410px-Ogallala

Features (from the website):

  • Accepts source SRS specs on the command line, allowing multiple input files to have disparate coordinate systems.
  • Generates the results projected to any SRS using Geo::Proj4.
  • Works on multiple shapefiles at a single invocation, layering them in order into the SVG map.
  • Supports specification of color and other rendering options, per source file, on the command line.
  • Optionally select subset of shapes by regex on arbitrary attribute fields.
  • Support coloring of shapes by value of an attribute field.
  • Allow specification of a shapefile to use in scaling but not in rendering. That supports independent production of layers to be later combined in an SVG editor; they can all be scaled and translated according to the geometry of the base/largest layer to aid layering after the fact.

You’ll need to have Perl installed on your system; see the download page on the official Perl site for links to several different versions. And you’ll need to be comfortable working in a command-line interface; no GUI available yet. Ken has a page documenting usage, along with an example page that describes how he created the image above.

HT to Ken (of course).


Georeferencing A General Textual Location With BioGeomancer

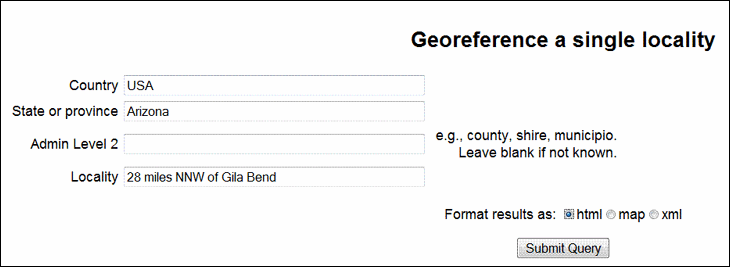
In the good old days, before 1994 or so, when commercial handheld GPS units first came onto the market, locations were often described in general textual terms, like “28 miles NNW of Gila Bend”, or “5 kilometers east of Mount Whitney”. BioGeoMancer Classic and BioGeomancer Workbench can parse these kind of textual descriptions, and convert them to a set of geographic coordinates.

The older Classic version has a text-only interface with limited options:

classic

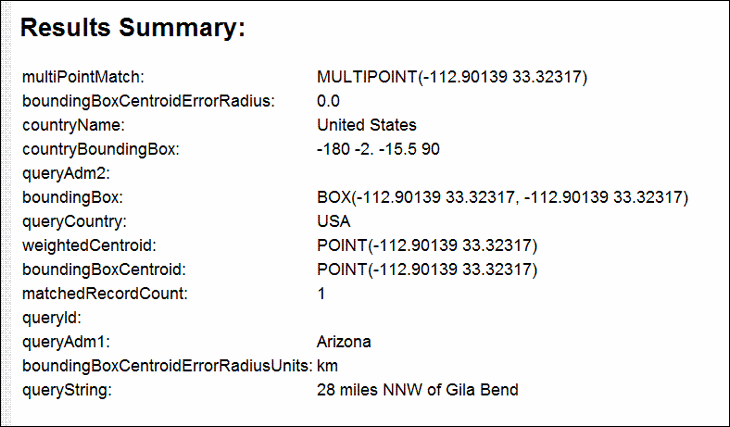
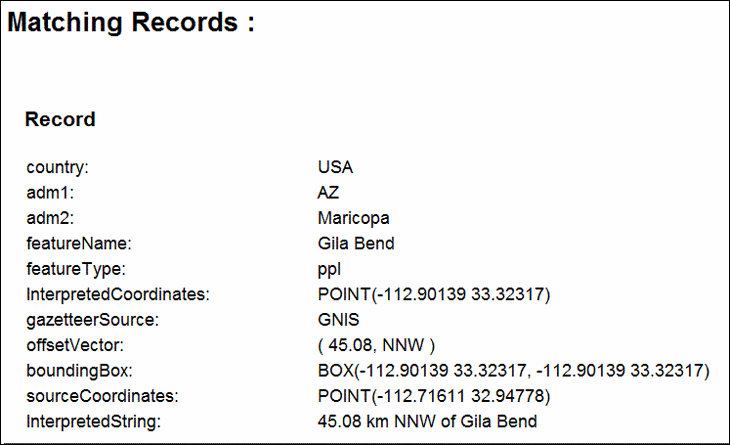
And gives a text output:

results

matching

The “Map” option in Classic doesn’t seem to work, but the XML option does. Since the Classic version is no longer under development, it’s likely to stay in this format

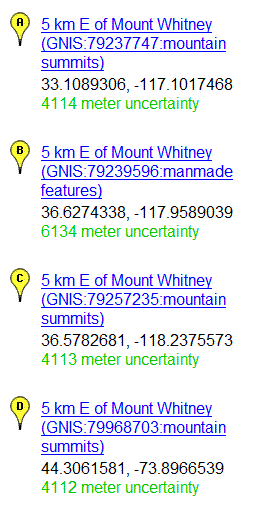
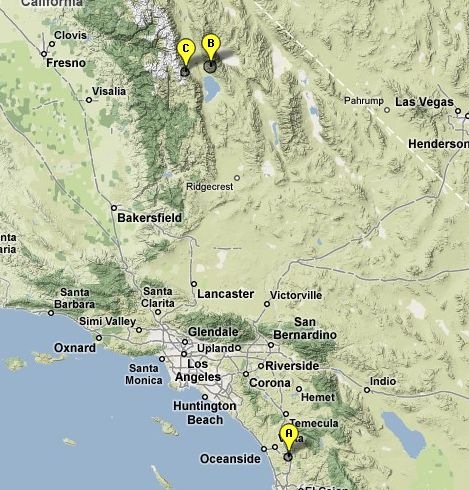
The newer BioGeomancer Workbench version, still under development, has a Google Maps based interface. Enter a locality like “5 kilometers east of Mount Whitney”, and get a list of localities with their locations plotted in Google Maps:

WhitneyList

In this case, I was looking for Mount Whitney in CA, but it came up with an additional one in NY. By using “5 kilometers east of Mount Whitney, CA” as the location reference, the NY locality would be dropped:

CAWhitney

The more general geographic info you can add, the better you will be able to narrow down the possibilities. It looks like you need commas to delimit geographic data, since “5 kilometers east of Mount Whitney CA” won’t return any results.

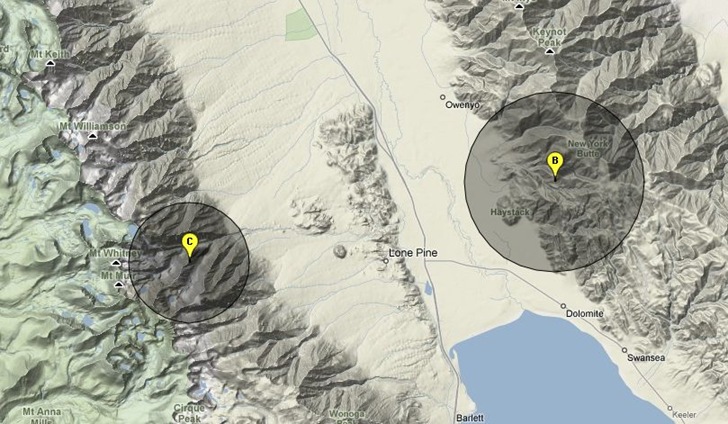
Zooming in on the northern localities shows them plotted, along with the location uncertainty as a darker circle:

closeup

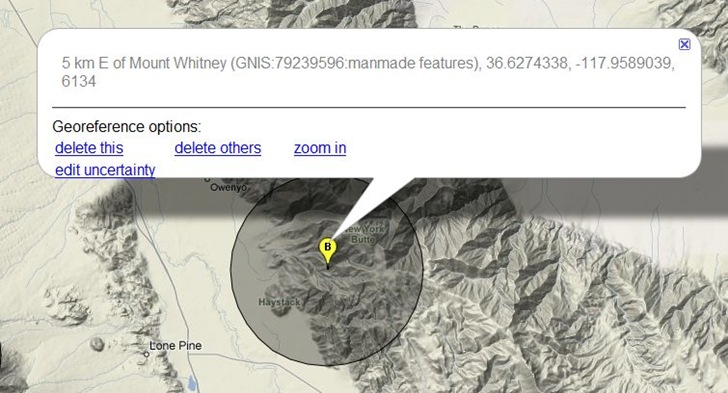
Clicking on a placemark brings up options to change the uncertainty radius, delete the placemark, delete all the other placemarks, or zoom in:

bgbubble

The only way to save the data now is to copy it from BioGeomancer and paste it into a different application. The help page indicates that in the future, you’ll have the option to save the data in spreadsheet format, and also do batch text georeferencing.


Map Maker Gratis: Free Map Editor

Map Maker Gratis is the free version of the professional $400 GIS and map editor Map Maker Pro. I’ve been meaning to try it out for a while, since even the free version has a very strong feature set. From the website:

  • Unlimited number of layers, raster and vector.
  • Colour, mono, and grey-scale bitmap backgrounds.
  • Large range of fill, line, and symbol styles
  • Translucent and semi-translucent fills.
  • Curved, stretched, and outline text.
  • Arrows, and dimensions.
  • Easy to create scale bars, north points, legends, text panels, inset images, etc.
  • Point-and-click to pop-up images, documents and internet links.
  • Print accurately scaled maps on any true Windows compatible printer.
  • Multi-sheet printing of large maps.
  • Create from new or import and edit.
  • Vector drawing and editing.
  • Intuitive cutting and joining of polygons.
  • Create polygons with islands.
  • Simple editing of common boundaries.
  • Numerous “snap-to” options.
  • Drag, stretch, rotate, duplicate groups of objects.
  • Create buffer zones.
  • Calibrate raster images.
  • Use data from DBF files to colour up a map or determine symbols.
  • Generate legends.
  • Measuring areas and lengths is simple.
  • Edit data sets.
  • Import vector data including ArcView SHP, MapInfo MIF, AutoCAD DXF, Idrisi VXP.
  • View BMP, TIF, Geo-Tiff,  and JPG raster data.
  • Export BMP, JPG, TIF.
  • Export DBF data to Microsoft Access, Excel, dBase etc.

The Pro version adds support for 3D, raster-to-vector, on-the-fly reprojection, export of vector features from the native .dra format to standard formats (shapefile, MapInfo, etc.),  and more; see the comparison chart for all the differences. And the install program lets you try out the Pro version for 30 days before it reverts to the free Gratis version. So it seemed worth a look on a simple map project I was doing for a friend as a favor.

Having struggled with the program for a few days, I can see that it does have many features; unfortunately, it also has a fairly steep learning curve, especially for those used to more conventional GIS programs. For example, modifying vector file display attributes isn’t done by modifying the layer properties, but rather by defining a “style”, a set of descriptions for things like symbol, line width, fill patterns and more, and figuring out how to do that effectively takes some work (and sometimes doesn’t work the way you expect). Getting labels to appear in the position I wanted was a chore, and some of the label controls didn’t seem to work. You can have multiple layers of vector data loaded, but it seems that you can only work with data in a single, “active” layer, i.e. you can’t edit or add points to layers other than the active layer.  There’s a large PDF manual that comes with the program, and at first glance it seemed to be comprehensive. But when I ran into problems and looked in the manual for answers, more often than not I couldn’t find them.

I suspect that if I worked long enough with the program, I would eventually figure out what it can and can’t do. There are some limited tutorials available for download at the site, along with links to tutorials by other users. Given the feature set, and the price point of $0 for the Gratis version, I can’t complain too much, and can see myself revisiting the program at some point in the future to give it a more complete review.

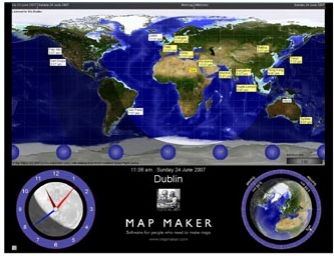
I should mention that the program authors generously offer free licenses for the Pro version to any non-profit organization, educational institution, or students in Africa. Also, there’s a world clock / sunlit area display program called Sun Clock available for a 30-day full-featured demo; at the end of 30 days, some features disappear (like views of the sky and stars), but the world clock /sunlit areas feature remains free.

SunClock


Disaster Response Map Symbols

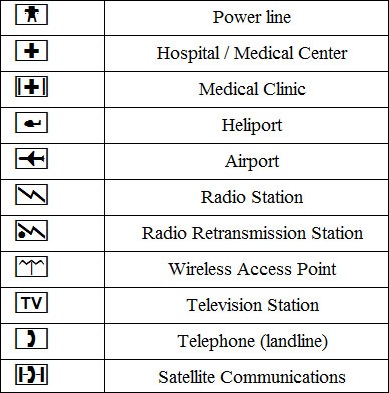
The Portuguese chapter of the Association Of Volunteer Emergency Response Teams, in collaboration with Peter Guth and Donald Springer, is working to create a general-purpose set of symbols useful in mapping the position and condition of infrastructure, resources and incidents during emergency situations. You can download these Disaster Response Map Symbols as a True Type font from the DRMS website, along with a PDF file that documents the symbols There are 253 symbols depicting infrastructure, resources and incidents (graphic from the help file for MicroDEM, Peter Guth’s freeware GIS):
drms table

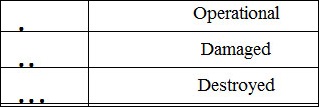
And additional dot symbols that represent the status of the higher-level symbol:
drmsstatus

These status symbols would be plotted directly below the higher-level symbol, to indicates its condition/status:
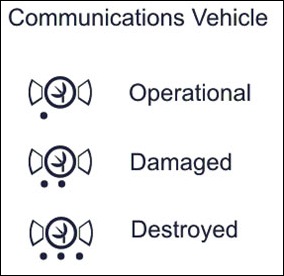
commstatus

Any GIS software that can use True Type fonts for symbols or labeling can use the DRMS symbol set directly. But MicroDEM has some special capabilities built in for working with this symbology. Make sure you’ve used the most recent program install, which includes the DRMS True-Type font; also, download the latest executable and copy it into the program directory.

From MicroDEM’s File => Tools menu, selecting Military icon generator brings up the icon composer window; make sure the DRMS tab is selected:
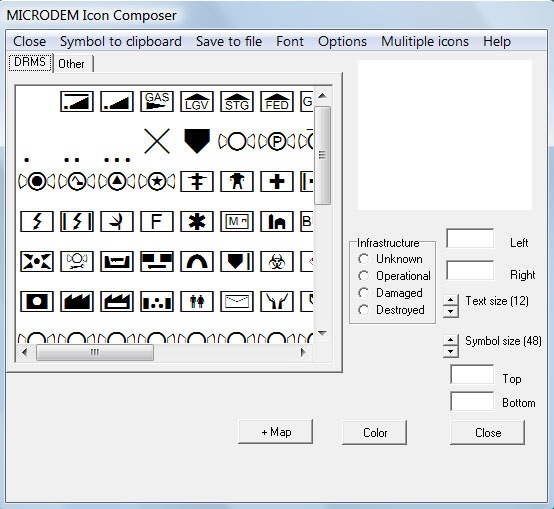
iconcomposer1

Double-click on an icon to select it, and then modify it as you like:

  • Use the color button to modify the color
  • Use Left/Right/Top/Bottom to add text around the symbol.
  • Select the Infrastructure status to plot dots depicting the status of the feature underneath the symbol
  • Modify the test and symbol size using the arrow keys
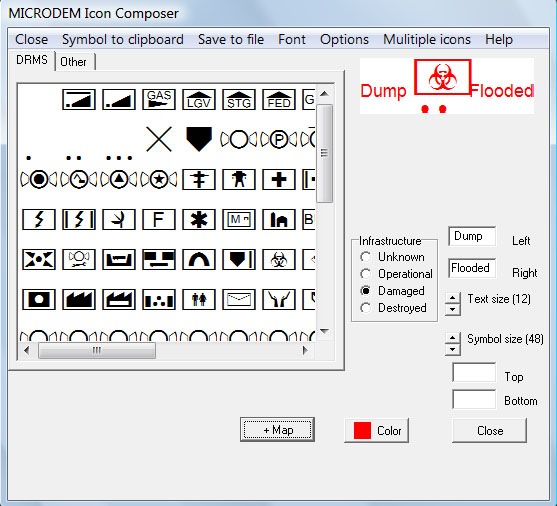
iconcomposer2

Once the symbol design is complete, you can save the symbol to the clipboard to paste into a graphics program, or choose “Save to file” to save it as a PNG, GIF, JPG, BMP or Targa format graphic file for those GIS programs that let you select graphic images to represent points.

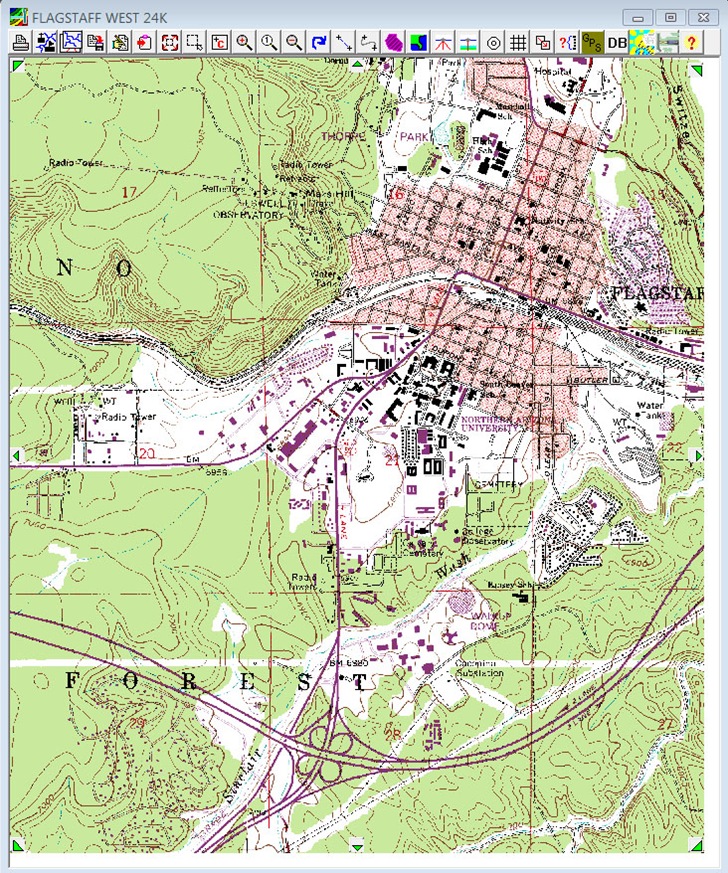
You can also plot these symbols directly on a map in MicroDEM. Open up a georeferenced raster image in MicroDEM:
raster

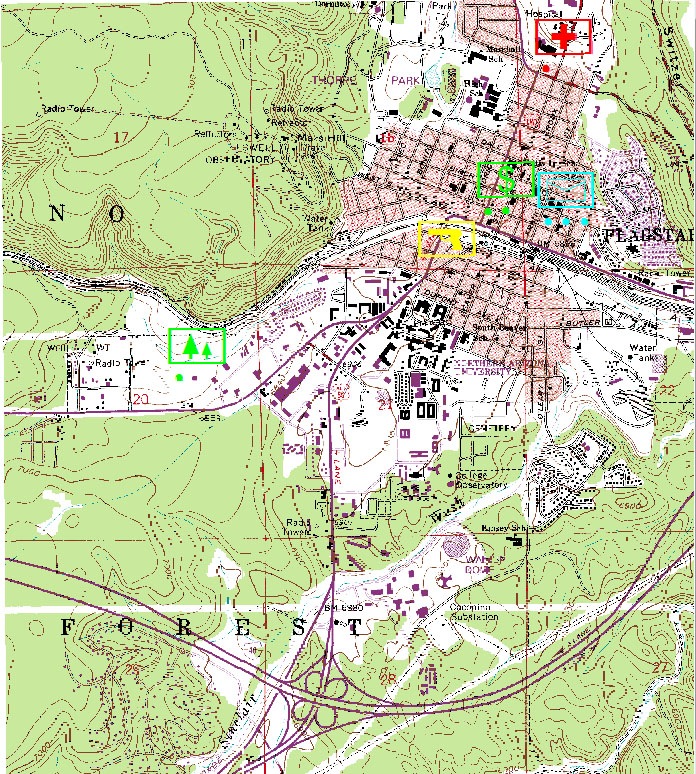
Clicking on the Map Annotation button on the toolbar (second from the left), choose Military icons from the drop-down, and then enter a filename to save the locations for the icons you want to place. You’ll then use the same Icon Composer interface as above to design your DRMS icons. The Left text is used as a feature ID in the DBF file, and also in the KML file you have the option of creating later on. Once you’ve designed your icon, you can double-click on the raster map to place the icon on that map:
mapwithicons

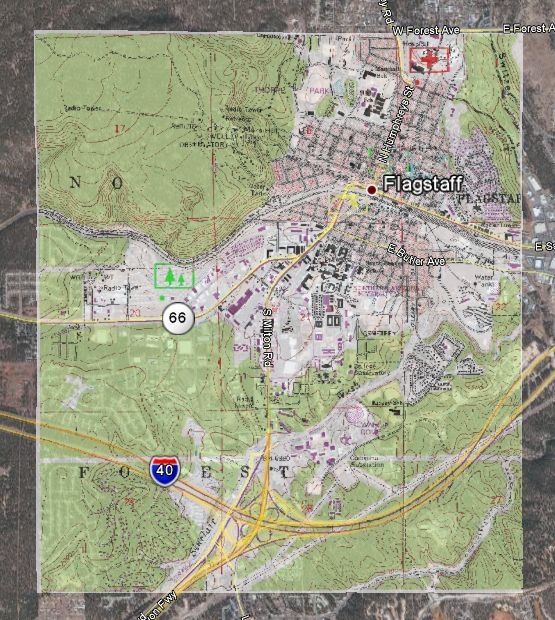
Click on the “Close” button in the Icon Composer when you’re done. You can now export this map image directly to a generic image file or GeoTiff using the appropriate File => Save … option. But by right-clicking on the map, choosing Load => Google Earth overlay, you can export both the raster image and vector points to Google Earth. Here’s the raster overlay in Google Earth (vector overlay is turned off):
drmsraster

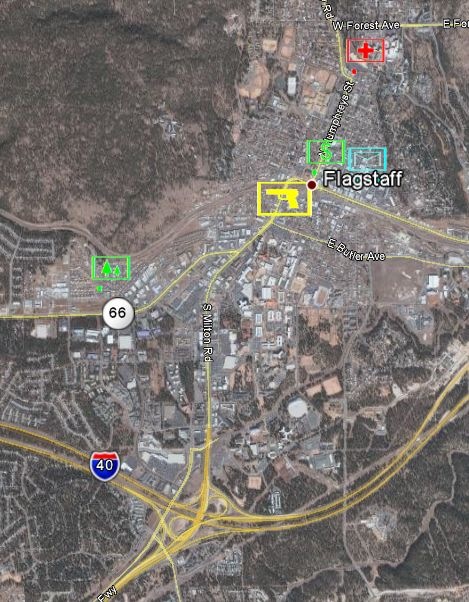
And here are the vector points, with the selected icons, for the same area (raster overlay turned off):
drmsvector

These data files are loaded into Google Earth automatically, but they’re not saved; to keep them for future use, right-click on the dataset listed in the Google Earth Places pane, choose “Save Place As”, then save it as a KMZ file.

Closing the Icon Composer will also open up a DBF  table window with the locations of the points you’ve just created; you can convert that to a point shapefile by clicking on the Report button, then selecting point shapefile. There’s also an option with this Report to create a KML file, but make sure you save this KML file in an empty folder. As I found out by testing it, this option creates a KMZ file, copies every single file in that folder into the KMZ file, then deletes the original file from the folder. If this happens to you, rename the KMZ extension to ZIP, then use your favorite unzipping program to extract out the original files. Also, the KMZ file contains only the KML text data, which  references the graphic icon files in a local directory on your computer for display in Google Earth. If you want to save this file for future use on your computer or another computer, and keep the graphics, you will need to open the file immediately in Google Earth, then save it as a KMZ file (right-click, choose “Save Place As”,etc.).


Early-Twentieth-Century Austro-Hungarian Military Maps Of Central And Eastern Europe

If anyone speaks Hungarian, perhaps they could translate the name of the site III. katonai felmeres for me. Fortunately, English text on the website explains what you find there: maps from the the 3rd Military Mapping Survey of the Austro-Hungarian empire, covering much of Eastern and Central Europe. The range covered goes from Istanbul in the southeast to Cologne in the northwest:

Continue reading ‘Early-Twentieth-Century Austro-Hungarian Military Maps Of Central And Eastern Europe’