A clever hack for the new version of Google Earth from Valery Hronusov and Barry Hunter of nearby.uk.org. Using the new capability of Google Earth to embed Flash into placemark bubbles, there’s now a KML network link at nearby.uk.org. Open it in Google Earth, and a white arrow will appear in the center of the screen. Click on the arrow, and a bubble will pop up giving you the choice of imagery for that area from a number of different online mapping sites (e.g. Google Maps, Yahoo Maps, Virtual Earth) using Flash Earth:
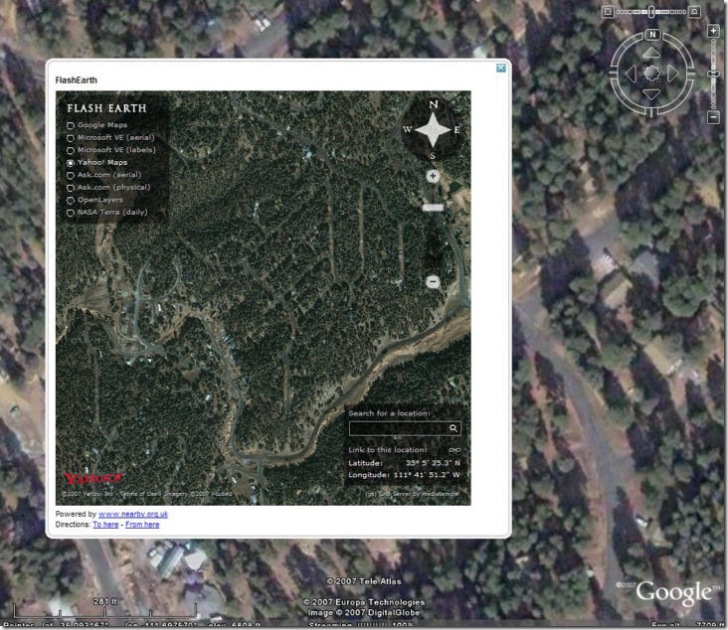
Requires the latest version of Google Earth running in Windows (GE for Mac and Linux doesn’t support embedded Flash yet).
Via Google Earth Blog.
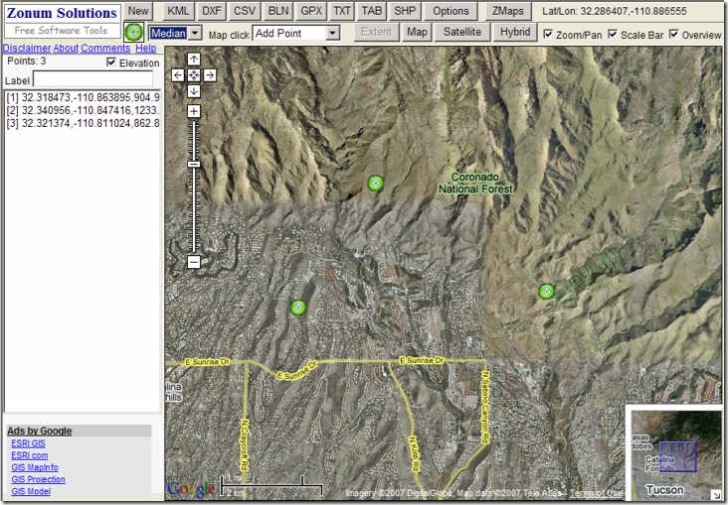
Quite a while ago, I posted about Digipoint, a website that let you plot points in Google Maps automatically get the coordinates of the points, and export the data in text (TXT), AutoCad (DXF), comma-separated values (CSV), BLN (Golden Software blanking format) and tab-delimited (TAB). The Digipoint website has been upgraded to version 2 since then, enhancing the old features and adding new ones:
- Export in KML, GPX, and shapefile formats has been added to the previous export options listed above
- Selectable icon shapes and sizes (Small, median, normal and big); click on the icon image to change the icon shape, choose the size from the drop-down next to it
- Four map-click options:
- Add point
- Delete point (new)
- Edit label (new)
- View elevation (new) – click on a point on the map and get the elevation
- Check the elevation box, and as you add points to your list, the elevation will be added as well
- An instantaneous readout of the cursor coordinates as you move it over the map display
- A separate “Options” button to set coordinate systems (lat/long. or UTM) and elevation units (meters/feet)
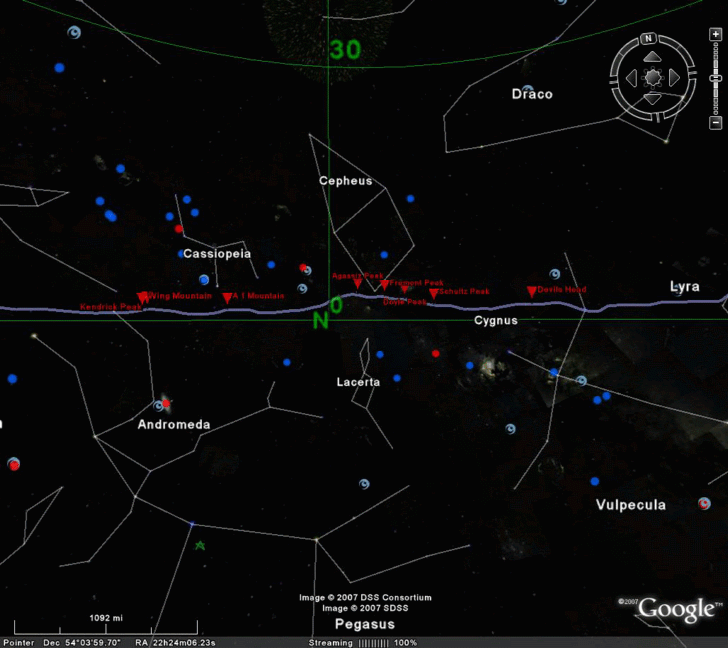
The creators of HeyWhatsThat, a site that generates panoramas and viewsheds for Google Maps and Google Earth and described in an earlier post, have added another cool feature. Generate a panorama, click on the “View in Google Earth … at night” link, have it open in Google Earth in Sky mode, and the horizon line will be plotted against the sky for the specified location, labeling each of the features. Lots of good stuff at the HeyWhatsThat site!
In addition to its primary terrain analysis functions, MicroDEM also has a number of map projection viewing features, accessible by opening a vector map from the File => Open => Vector Map menu, or clicking on the “Open vector map” button on the top toolbar:

This brings up the “Map Projections” window:
Continue reading ‘Stand-Alone Map Projection Viewers III – MicroDEM’
Newer Garmin GPS units support the upload of sets of POIs, containing both position data and descriptions of the Points Of Interest. The KMLCSV Converter is a Java application that lets you convert placemarks created in Google Earth and saved as a KML file into a CSV (Comma-Separated Values) file compatible with Garmin’s POI Loader; this CSV would also be compatible with most spreadsheet programs as well. The process is straightforward:
1. Create placemarks in Google Earth using the “Add Placemark” tool, search, or other means.
2. Add a description to the placemark.
3. Drag all the placemarks you want to save into a single folder.
4. Save the folder as a KML file
5. Convert it to a CSV file with the KMLCSV Converter Program (screenshot from website)
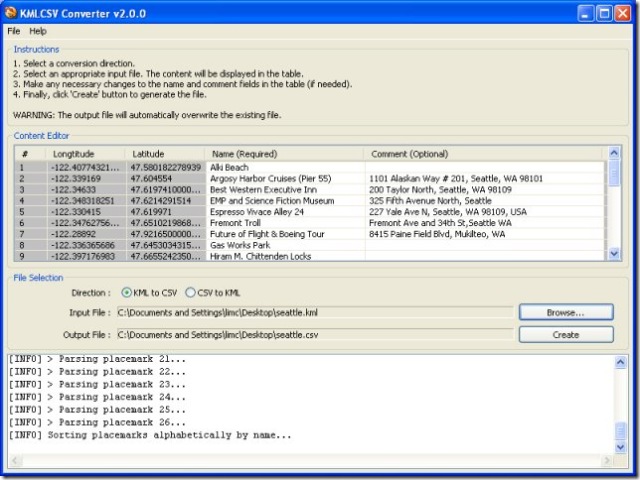
6. Upload the CSV POI file to your Garmin with the POI Loader program, or into your spreadsheet as a standard CSV file.
There’s a short PDF tutorial file that covers these steps quite clearly with screenshots.
You can also convert CSV files, either POI files or spreadsheet files created by yourself or someone else, into KML files for viewing in Google Earth; a search for “Garmin POI” files on the web will bring up links to many sources, both free and paid. But I prefer the program csv2kml for that purpose.
In addition to a subscription service with more data, features and capabilities, Social Explorer offers an easy-to-use demographic data mapping and download service, with US Census data from 1940-2000. Select from population, age,sex, marital status, race, education, housing, industry and many more. Each category has its own set of subcategories to choose from for mapping, e.g. for population you can plot population density, % urban, % rural, % inside urbanized areas and % inside urbanized clusters.
The Maps Social Explorer opens up a Flash (?) interface, with demographic parameters selectable using the drop-downs at the upper right. Mapping can be done by census tract (as above), or by 2000 Congressional District boundaries. You can zoom into any area of the US:
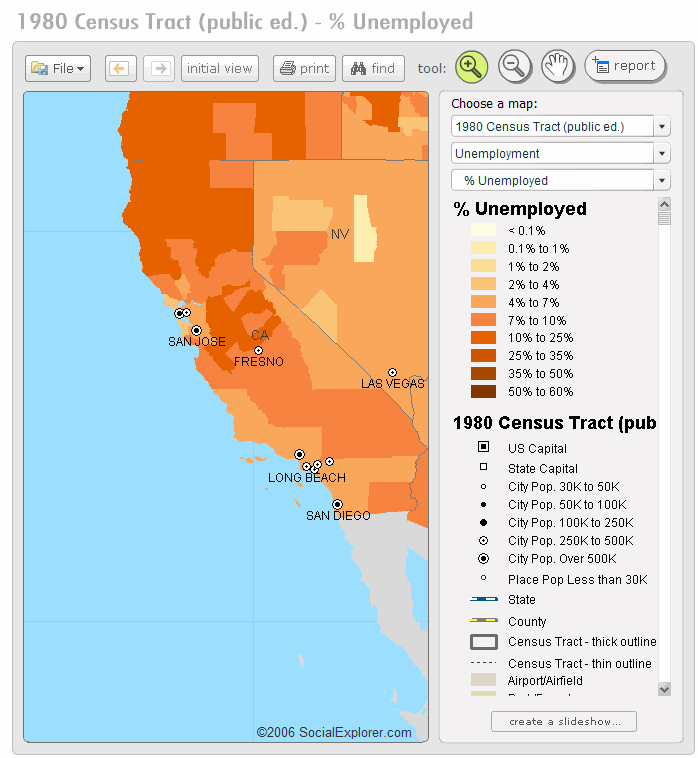
Select Print, and the map and legend will open up as images in a separate window, so that you can save or print them. Select Report, and you can view tabular data for a selectable area of the visible map, and download it in Excel format.
With the Reports Social Explorer, view similar demographic data for the entire US, state, county or census tract in tabular format on-screen, and download it in Excel format.
A team of scientists at MIT have developed a software tool designed to analyze “visual clutter” in graphic images. The example given in the press release compares the tool’s analysis of visual clutter in maps of the US and San Francisco with that of 20 people, and they found a good correlation between human and software clutter metrics. The software is free for download and use, but requires MATLAB to run (which I don’t have, so I can’t test it out).
Via Lifehacker.
G.Projector, posted about earlier, only produces flat, non-interactive map projection images. map projection is a stand-alone map projection viewing program with interactive capabilities. It was written to demonstrate a concept called the “floating ring”, where you can move a circular figure about a globe and watch the change in its distortion in a map projection viewer – sort of a souped-up interactive version of Tissot’s Indicatrix. The program is available for Windows, Solaris, and IRIX; be sure to download the coastline data file as well, and put it in the same directory as the executable.
Continue reading ‘Stand-Alone Map Projector Viewers II – map projection’

