blankblank blank


Author Archive for Leszek Pawlowicz Page 10 of 79


Thematic Mapping Engine API For Displaying Your Own Data In Google Earth

Almost a year ago, I posted on Bjorn Sandvik’s Thematic Mapping Engine, which can plot data thematically in Google Earth as:

  • Choropleth
  • Prism
  • Proportional symbol
  • Pie chart

At the time, you could only use a limited number of pre-packaged datasets. Bjorn has just announced the Thematic Mapping Engine API, a Javascript library that lets you do thematic mapping in the Google Earth plugin with your own data (including online sources like Google Docs Spreadsheet). Still in beta, and Bjorn is looking for people to try it out (non-commercial use only). Documentation is a bit sparse right now, but if you look at the page source for example maps created with the API, it’s not too hard to figure out.


Free Tools For ArcGIS Server (And A Request For Ideas For More Free Tools)

David Enns of MapItOut writes:

Subsequent to the development of low-cost tools by Map It Out in previous versions of ArcGIS Server, the company will now release these tools free of cost, starting with ArcGIS Server 9.3. It will be seeking input from users to develop other no cost tools. Map It Out Inc. hopes to offer several other ease-of-use and multi-functional tools at no cost in the upcoming months based on the input/demand from the GIS community.

The first available tools are:

  • Area & Buffer Selection Tool
  • Bookmark Tool
  • Hyperlink Tool
  • Export Tool
  • Custom Query Tool

I don’t use ArcGIS Server, so can’t evaluate them; for anyone who does try them out, I’d welcome your opinions in the comments section.


Make Your Own Map Projection With Flex Projector

While most maps, paper or computer, are flat, the world isn’t. Map projections are mathematical methods for representing part or all of the quasi-spherical Earth (irregular oblate spheroid, to be more precise) on a flat surface. The book Flattening the Earth: Two Thousand Years of Map Projections, covers the history and many of the hundreds of projections devised to “flatten the earth”. And I’ve covered a few map projection viewers on this blog before.

Just as a map projection viewer alone, Flex Projector (Java; versions for Windows, Linux and Mac) would be worth a look. It has over 25 pre-defined map projections that you display (along with listed values for their areal/scale/angular errors), and includes the ability to display two projections at once for comparison purposes (here, Plate Carree in black vs. Mercator in gray):

Continue reading ‘Make Your Own Map Projection With Flex Projector’


Easy Google Maps Route Creation With NetKvik

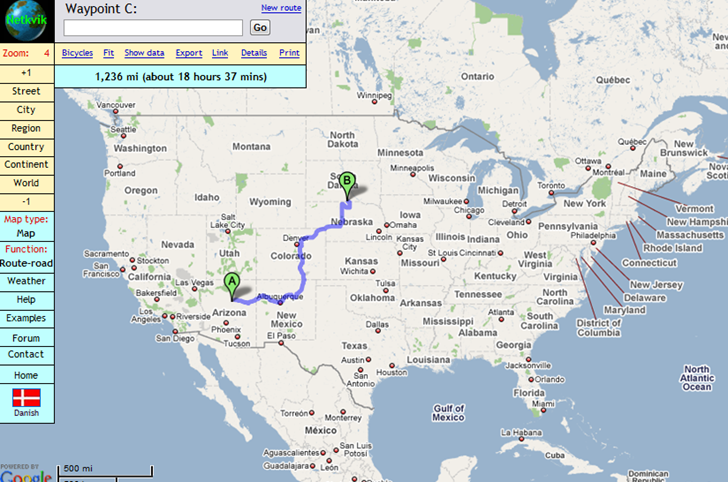
NetKvik offer an alternate interface to Google Maps for creating routes from one location to another, with easier access to some of Google Maps’ standard options, plus a few added features.
netkvik

Probably the most confusing feature of NetKvik is the zoom function, or the apparent lack of one at first inspection; there’s no standard Google Maps zoom slider. But you can use the +1 and –1 buttons at upper left to zoom in and out, and use the level buttons to jump to gross zoom levels like city, region, or continent; the mouse wheel also  zooms the map in and out. Once you get past that quirk, NetKvik offers a lot.

Like Google Maps, you can drag and drop the destinations and track to modify the route; you also have the option to bypass highways (using the Function menu to select that option. You can also create a link to the map with the route drawn. But unlike Google Maps:

– You can add successive destinations not only by entering the location in a search box, but also by clicking on the map

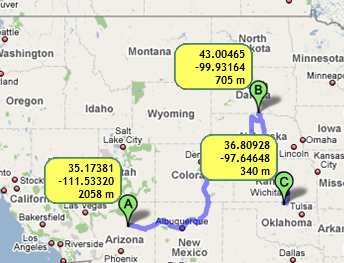
– Click on Show Data to get coordinates and elevations for your destinations:
nkdetails

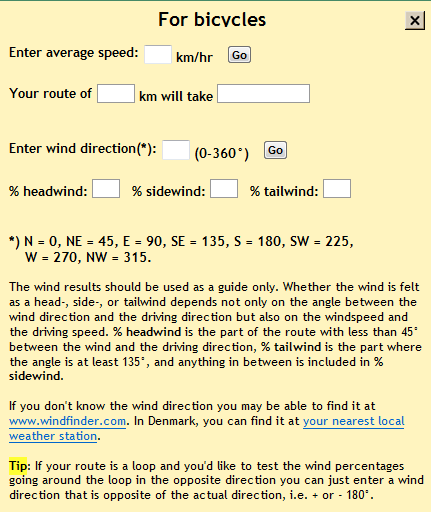
– Click on Bicycles to enter details like travel speed and wind direction to get travel time and headwind/tailwind details for a bike trip:
nkbicycle

– Use Details to toggle on/off driving directions; total travel distance is always shown. Print prints out driving directions.

– Option for Point to point routes (great circle routes plotted between destinations)

– A coordinate function option displays latitude/longitude next to the cursor:
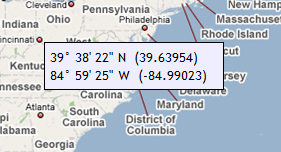
5-10-2009-9.40.21 PM

– Export a KML file for your trip in one of three formats:
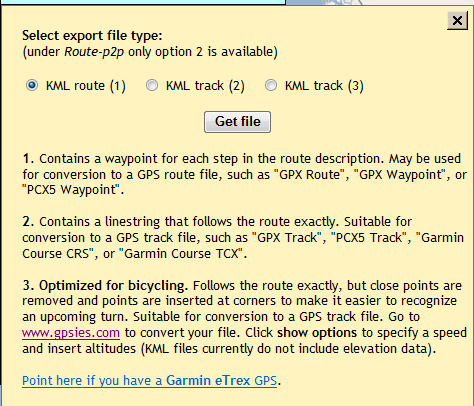
nkexport

– Weather brings up a weather map from Weather Underground for the location you’re viewing.

– Moving the mouse over every button/feature pops up a concise but useful help screen; when those pop-ups get to be too annoying, you can turn them off.

HT to Carl DK.


Excel Spreadsheet Data To Google Earth Thematic Map

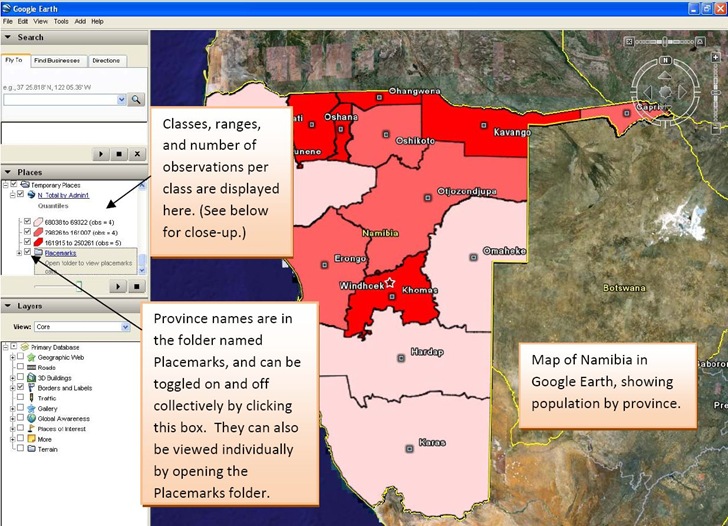
After yesterday’s post on thematic mapping in Google Maps, John Stewart  of the University of North Carolina’s MEASURE program wrote to tell me about their own thematic mapping tool, the E2G Thematic Mapper. This Microsoft Excel macro spreadsheet data and links it with polygon data for countries and their administrative units to create thematic maps for Google Earth:

Excel data to Google Earth thematic map

Image is from the excellent PDF manual included with the distribution. I can’t try it out because I don’t currently have a computer with Excel (2003 or 2007), and it doesn’t seem to run on Open Office Calc.

It also currently only has polygon data for sixteen countries:

  • Botswana
  • Côte d’Ivoire
  • Democratic Republic of the Congo
  • Ethiopia
  • Guyana
  • Haiti
  • Kenya
  • Mozambique
  • Namibia
  • Nigeria
  • Rwanda
  • Tanzania
  • Uganda
  • Vietnam
  • South Africa
  • Zambia

But John says that an update coming this summer will add polygon data for more countries, along with more macro features.

If you’re interested in field data acquisition, the entire Monitoring and Evaluation Systems section of the MEASURE site is worth a look.


Thematic Data In Google Maps With Plug And Play Maps

Chris Duncan writes to let me know about his online mapping tool/service, Plug and Play Maps (slogan: “Just Add Data”), that lets you take data in number of formats:

  • Spreadsheet/text (CSV)
  • JSON string
  • DBF
  • KML
  • Shapefile
  • Web database

And display it as a thematic map in Google Maps, with colors/shapes representing thematic values (with limitations for some formats like KML and shapefile). Some live examples shown on the website include:

Continue reading ‘Thematic Data In Google Maps With Plug And Play Maps’


Online GPS Format Conversion And Track Creation With GPSies

GPSies is a site whose primary function seems to be as a social site where you can upload tracks of your travels, and have them posted on a map to keep track of them or share them with others. Tracks can be uploaded from standard formats like GPX or KML, directly from Garmin GPS using the Garmin Communicator plugin, or from the iPhone using their free app. This social aspect isn’t something I’m all that interested in doing, so those features are wasted on me. But the site has two tools that GPS users will find useful:

Continue reading ‘Online GPS Format Conversion And Track Creation With GPSies’


Additions To List Of Free GIS Programs For The Mac

A few more additions to the full list of free Mac GIS software, where they will be added shortly; you need only bookmark that preceding link to have it as a complete and regularly-updated reference.

Grid Analysis and Display System (GrADS) – “The Grid Analysis and Display System (GrADS) is an interactive desktop tool that is used for easy access, manipulation, and visualization of earth science data. The format of the data may be either binary, GRIB, NetCDF, or HDF-SDS (Scientific Data Sets).”

MARPLOT – “MARPLOT is the mapping application. It allows users to “see” their data (e.g., roads, facilities, schools, response assets), display this information on computer maps, and print the information on area maps. The areas contaminated by potential or actual chemical release scenarios also can be overlaid on the maps to determine potential impacts. The maps are created from the U.S. Bureau of Census TIGER/Line files and can be manipulated quickly to show possible hazard areas.”

Puzzle-GIS – “Puzzle is a Java Geographic Information Systems (GIS) development platform build on top of NetBeans6. The main goal of Puzzle GIS is to create a free, production ready and competitive tool as a valid alternative to commercial software.”

Spatial Commander – A free German GIS program. This link (in German) lists its features.

Spatial Data Integrator – “Spatial Data Integrator (SDI) is an ETL (Extract Transform Load) tool with geospatial capabilities.”

STEM – “The Spatiotemporal Epidemiological Modeler (STEM) tool is designed to help scientists and public health officials create and use spatial and temporal models of emerging infectious diseases. These models could aid in understanding, and potentially preventing, the spread such diseases.”