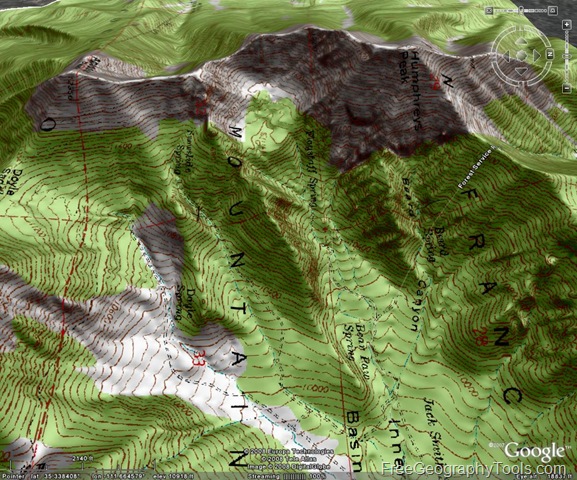
In a previous post, I talked about using MicroDEM to easily create Google Earth ground overlays, images draped over Google Earth terrain in the correct position, like this terrain-shaded topo map (viewed in Google Earth):
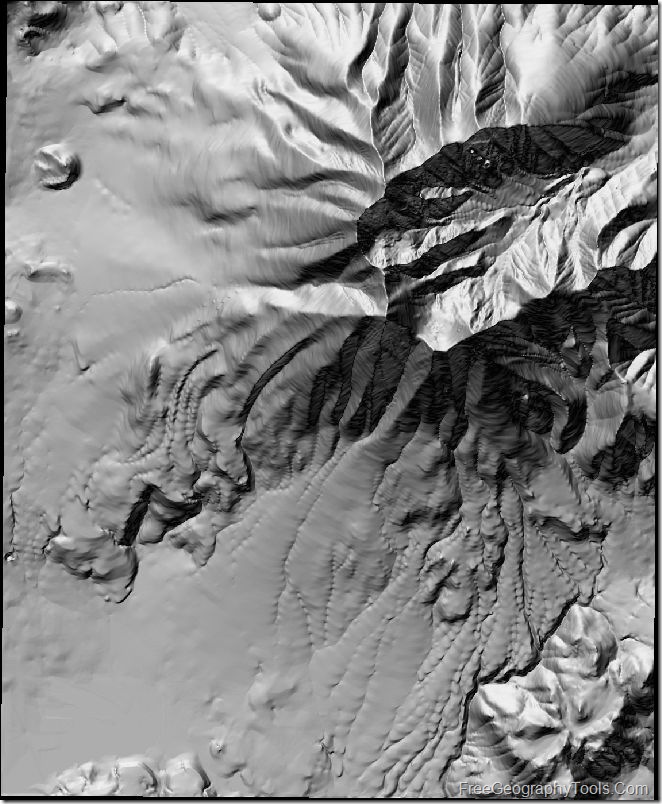
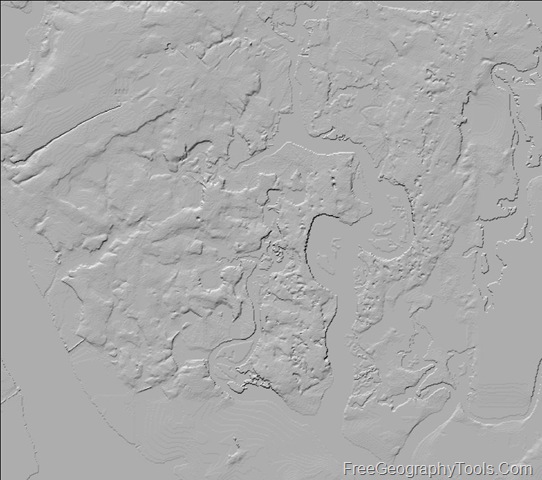
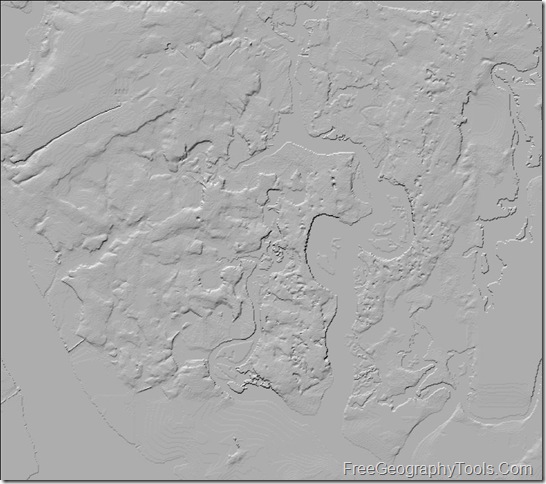
But you can also create a Google Earth ground overlay in MicroDEM as a GIF with transparency, where any part of the image that’s white will be invisible in the Google Earth overlay. There are a number of MicroDEM analysis functions that can produce a graphic product with the data product in color and the background in white. One example would be the terrain category function, where you can select parts of terrain based on parameters like slope, elevation, aspect ratio, and relief. Suppose I have a DEM displayed in reflectance mode:
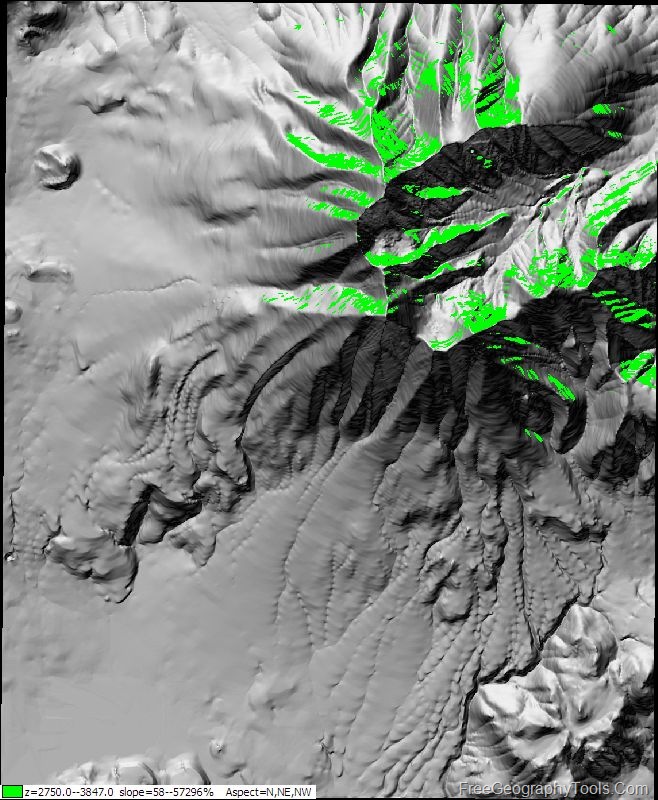
Using the Raster GIS => Terrain categories function (see this post for more info), I can select for areas of this terrain that are above 2750 meters, facing northward, with a slope greater than 30 degrees (which are areas that might be expected to have snowcover longer into the spring):
After creating the overlay, I can right-click on the DEM, choose Display Parameter => Blank, and have the graphic show only the category area in color, with the rest of the graphic white:
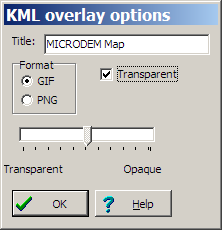
Right-click on the graphic, choose Load => Google earth overlay, and select GIF as the graphic type with the Transparent box checked:
And the overlay will open in Google Earth:
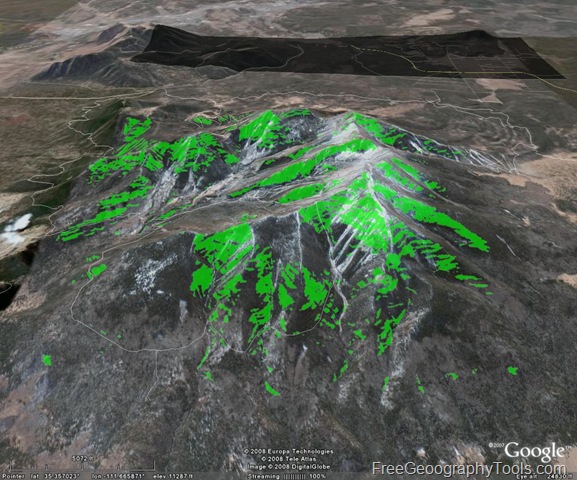
The areas that were white in the original graphic are completely transparent in the overlay. The green areas are partially-transparent, but you can adjust that transparency in Google Earth.
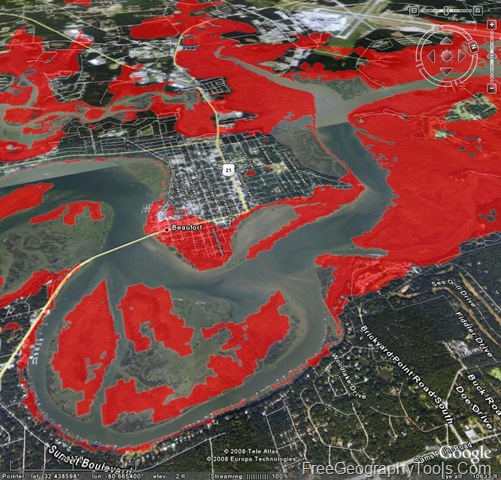
For another example; here’s a DEM from Beaufort, SC:
If I select those areas with elevations from .0000001 to 3 meters, I can see which areas would be flooded by a 3-meter storm surge (or 3 meters of sea level rise due to global warming):
This is cheating a bit, since this should be done with a basin flood (as in this post), but it’s a lot faster this way. Open this image as a GIF overlay with transparency in Google Earth:
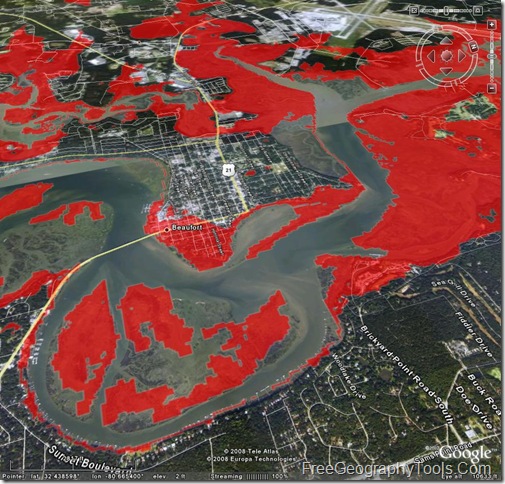
… and you’ll see (very approximately) what land areas might be covered by water in the event of a 3-meter storm surge.
This will work with any georeferenced image opened in MicroDEM, not just those created by the program itself; any white area will become transparent in the overlay. In an upcoming post, I’ll show how you can do that with a USGS topo map, even one that has lots of non-white areas on it.
Note: Google Earth sometimes has problems displaying large GIF overlays; if your overlay doesn’t work, try re-sizing it.
Basin flooding is only valid for a storm surge, where a range of hills may indeed block a temporary flood. If the water table is raised, a range of hills is only a temporary barrier and how quickly water goes through the hills depends upon the geology of those hills.
You’re right, of course, and the post I reference describes how to create a basin flooding map using MicroDEM; you could use that basin flooding map instead of a flood fill as a Google Earth overlay.
With this DEM, though, there’s an additional problem doing a basin flood calculation. Because this DEM covers a limited geographic extent, if I start a basin flood calculation on one point, and if there’s a land mass that blocks it completely, the area behind that blocking mass won’t be flooded in the simulation, even though in real life there would be likely be other routes around that block to allow flooding to take place. The solution for that would be to use a DEM that covers a wider geographic extent.