If you own an NMEA-capable GPS receiver, there are a substantial number of programs available for free that can monitor and display NMEA data. But my current program of choice is VisualGPS, because in addition to several commonly-found functions, it has one potentially very useful function that I haven’t found in any other similar program. Note: A version of VisualGPS with similar functionality is also available for Windows CE/Mobile devices.
After you’ve installed the Visual GPS program, started it up, and configured it to connect to your NMEA COM port (perhaps the one defined by XPort, described in yesterday’s post), you’ll have access to five function panels from the toolbar:
![]()
From left to right:
Command Monitor Window – Displays the NMEA text strings as they come in. You have the option of saving this data as it arrives to a text file.

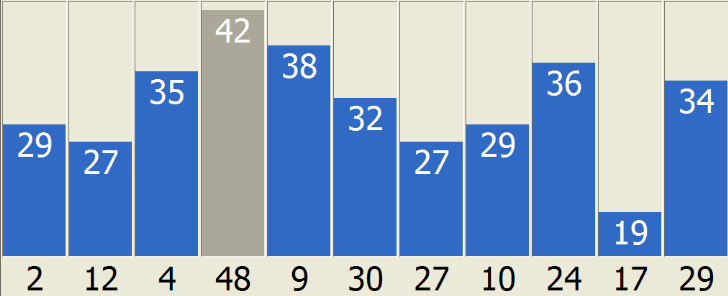
Signal Quality – Displays the signal strength of the GPS satellites acquired by the receiver, and whether the almanac data has been received – gray for no, solid blue for yes. For WAAS satellites, like #48 below, there is no almanac, so the signal bar is always gray:
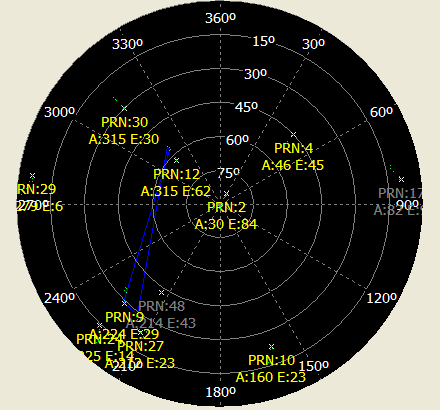
Azimuth And Elevation Window – Shows the position of the GPS satellites above the horizon:
Navigation Window – Shows latitude, longitude and altitude; if you’re in motion, also shows speed and distance traveled:

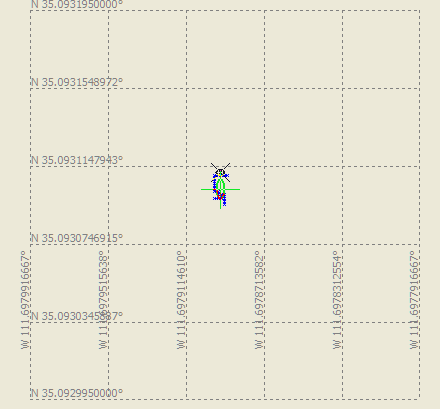
Survey Window – This is the most interesting and unique function. It will gather position data, and plot it in the top map window so that you can observe how the measured GPS position changes with time. Positions are plotted as small blue “x”es:
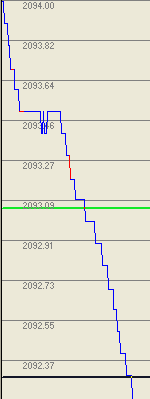
The measured altitude is plotted versus time, with the average altitude as horizontal green line:
And there’s a data display window that shows average and standard deviation data for latitude/longitude/altitude:
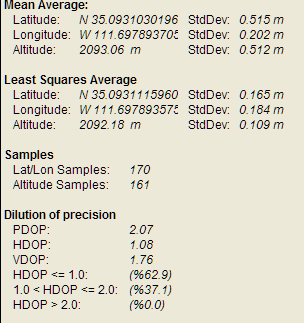
There are two averages that you can measure: the arithmetic mean (sum of all data divided by the number of points), and a least-square average (minimizing the squares of the differences between the mean and all the points together). In principal, the latter can give you a more accurate average, since it won’t affected as strongly by a single outlier point as the arithmetic mean. Standard deviations are also given for both sets of statistics. In the map window, averages are plotted as crosses and the standard deviations as axes of an ellipse, green for arithmetic, black for least-squares.
At the bottom of the data display, you can see the instantaneous Dilution of Precision values, as well as the number of measurements that fall within the specified DOP bounds (the lower the DOP, the better). Under the Survey Settings menu, you can set the maximum acceptable value of DOP for a point to be used in averaging, rejecting points with potentially poorer accuracy for determining an average position. Finally, you can save the plotted data and averages as a *.pth file, and open it later on; unfortunately, you can’t access the individual point position data, as it’s a binary format.
Using this Survey averaging function, and a knowledge of what affects GPS accuracy, you could in principle determine the geographic coordinates of a position with reasonable accuracy. How reasonable, and which average is the better one? And how does the positional accuracy depend on the type/brand of GPS receiver? I can’t say from the data above, since I don’t know the exact coordinates of the position where my Bluetooth GPS receiver is currently sitting. So I’ll be taking my laptop and two GPS receivers to a nearby National Geodetic Survey benchmark over the next few days, along with DOP plots for various times of the day, to see how closely the GPS positions agree with the benchmark position determined with a high degree of accuracy. Stay tuned …