In a previous post, I used the program VisualGPS to compare the positional accuracy of a Garmin 60Cx GPS receiver with a Holux M-1000 Bluetooth receiver, measured at a National Geodetic Survey marker of known position. The average position of the Garmin wound up being closer than that of the Holux, but the distribution of positions for the Garmin was far wider than that of the Holux. To compare the GPS receiver results another way, I measured positions from both units over the same period of time, then determined the Circular Error Or Probability (CEP) for both.
The CEP is determined by the number of points within a certain distance of a specific location as a percentage of the total number of points. So the CEP for 50% would be the distance within which half the points would lie closer to a specific location. The free program DNRGarmin can calculate the CEP from the following sets of point data:
– If you have a Garmin GPS unit with either USB or Garmin Serial output, you can record the real-time position directly with a set time increment.
– You can also monitor an NMEA-capable GPS signal, but the time increment appears to be fixed at 5 seconds
– You can set a GPS unit to log a track at a set time increment, and log that track at a single point. Export the data to a GPX file, and DNRGarmin can read it in.
– DNRGarmin can also read in point data in shapefile, DBF and CSV format.
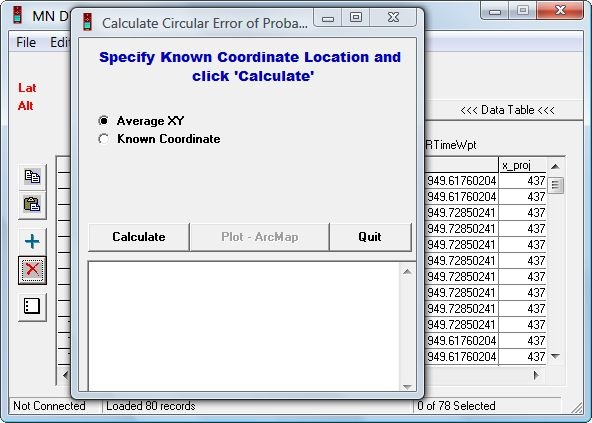
Once the data is in the program, choose Edit => Calculate CEP from the menu:

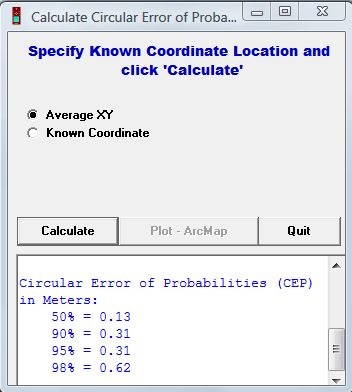
You have the option of either using the average position of all the points, or entering the known coordinates of a position. For comparing the Garmin and Holux GPS units, I used both the average position and the known position of the benchmark. Click on Calculate and get the results in the text window below:

DNRGarmin also gives you the average position, and standard deviations, for the data you’ve used. If you have ArcMap installed on your computer, you can export the data into the program and display it graphically; see this report for an example of those plots. I don’t have ArcMap on this computer, so I’ve just tabulated the results below. Here’s the first run:
| CEP | Garmin (from mean) | Holux (from mean) | Garmin (from known) | Holux (from known) |
| 50% | 2.30 | 0.25 | 2.45 | 3.08 |
| 90% | 4.87 | 1.03 | 5.86 | 3.60 |
| 95% | 4.99 | 2.42 | 6.19 | 3.76 |
| 98% | 5.31 | 2.59 | 6.37 | 3.80 |
The numbers are distances in meters from either the mean position, or the known benchmark position. Looking at the mean position, the Garmin has a far larger distribution of positions than the Holux. For the known position, the 50% CEP is lower for the Garmin, but the other three CEPs are substantially lower than those for the Holux, even though it shows a systematic skew from the true position. If the given benchmark position was off by a bit, and actually closer to the Holux’s average position, that might explain these results, but that’s just speculation.
Another set of measurements, with similar results:
| CEP | Garmin (from mean) | Holux (from mean) | Garmin (from known) | Holux (from known) |
| 50% | 1.00 | 0.13 | 1.37 | 1.76 |
| 90% | 2.10 | 0.31 | 2.43 | 2.02 |
| 95% | 3.17 | 0.31 | 3.06 | 2.02 |
| 98% | 4.27 | 0.62 | 4.26 | 2.02 |
Finally, comparing the mean position from both runs to the known position, and to each other:
| GPS Unit | Known – Run 1 | Known – Run 2 | Run 1 – Run 2 |
| Garmin | 2.29 | 1.51 | 1.23 |
| Holux | 2.85 | 2.22 | 1.77 |
The mean position from Garmin measurements is closer to the known position than the Holux for both runs, and the differential between the two runs is also smaller.
Not quite sure what to make of this; the tighter distribution of the Holux data is a point in its favor, especially if you’re only averaging positions over a short period of time. But for longer periods, the Garmin mean is closer to the true value. I’m kind of wishing that the benchmark position is incorrect, since that would tip the balance towards the Holux, but I doubt that’s the case. I’ve got one more program that can look at GPS position as a function of time, and calculate averages; that’s the next post.
And yes, there actually is a reason I’m wasting so much time looking at the accuracy of GPS units; that will become clear in a future series of posts under preparation.
I would seriously consider the accuracy of the benchmark. I’ve had students do a lab with cheap old Garmin ETREX units to get the location of a tidal benchmark, and we always get differences from the NOAA position about what you’re getting. I also know that the bench mark in question was physically moved when the pier was refurbished, and cannot get any word from NOAA that they resurveyed it, and the station history does not reflect the move.
The other thing that I would look at is quantization of the positions–with our units you can only get values that are about 1 m apart, and nothing in between (it’s actually 0.01 minute, I think). I don’t know if newer units change this, or if the method affects the results–we download the tracks. For most uses the level of accuracy is good enough, and the quantization makes a good student learning point.
I would serioulsy survey that point with a DGPS.
Not that I would doubt the benchmark position, except when known or when the BM has been placed at an obviusly bad place (I’ve seen one put over a landfill). In any case, ask the NGS as to when the BM was last resurveyed.
I don’t think it really make a difference if the benchmark was off. Looking back at your earlier post, I’m inclined to believe that the answer lies in the position plots. While the Garmin’s plots seem to be widely scattered, they’re widely scattered in pretty much all directions. The Holux’s points, while having a much tighter grouping, seem to concentrate themselves in three principle directions (generally, East, West and Southwest). The Holux plots are notably absent Northward and Southeastward. It just stands to reason that the Garmin would average closer to the center, regardless of where that center actually is.
Remember that you’re dealing with GPS data downloaded as WGS84 by DNR Garmin (DNRG) and projected to a local coordinate reference system. DNRG uses Proj4 to do the projecting and I don’t know how accurate this is likely to be in your part of the world. In my neck of the woods, southern England, I get an error of about 1.5 metres when projecting from WGS84 to OSGB using DNRG. It might be worth checking what your conversion errors are.
Regards, N.
Standing the Garmin up will make quite a difference as opposed to laying it down, having considerable (daily) time with GPS60, 60CSX, Trimble GeoXH (2008 Series)& GeoExplorer3 w/wo Hurricane & Zephyr antenna setups, Magellan Triton 500 and 1500, DeLorme PN-20 & PN-40, and Ashtech (Thales/Magellan) ProMark 2 & Promark 3 units, over the last 5 years. The Garmin was meant to be used pointed upward for best acqusition (quadrifillar-helix) versus Holux glorified patch (like the Trimbles) face-up orientation for best acquisition. Try it again.
Tried it again with the Garmin at a random point, with the antenna vertical:
50% = 0.49
90% = 0.79
95% = 0.91
98% = 1.40
Results are better, but there was still a NW-SE axis to the data. If I get more time and two Garmins, I’ll try to compare horizontal and vertical at the same time.