Via Vector One, I discovered Kelso’s Corner, a blog by an award-winning cartographer for the Washington Post; it’s been added to my blogroll at left. In turn, that blog pointed me to Color Oracle, a free Java tool (Windows, Linux and Mac) for evaluating the effects of several kinds of color blindness. I was surprised to learn that 8% of the male population suffers from some variety of color blindness (that’s about 1 out 12), so keeping their limitations in mind is important. Run the program, and it lets you choose between the three most common kinds of color-blindness: Deuteronapia (most common), Protanopia (rare) and Tritanopia (very rare). It changes the coloring of the entire monitor to reflect what it would look like if you had that specific kind of color blindness, and plasters a big label on the screen to let you know which kind of color blindness is being simulated. Click anywhere on the screen to return to normal color. The program also lets you get a screen capture of the color-blind view.
I tried it on a simple map graphic I made with a friend recently, and was shocked at the results. Here’s the original map, showing vegetation biomes in Arizona:
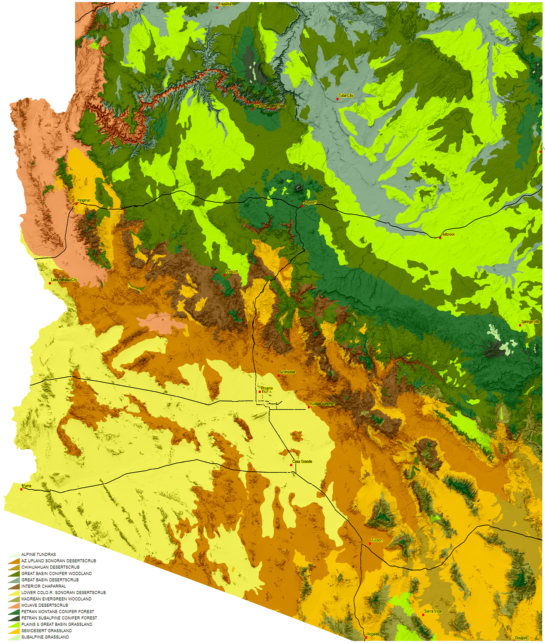
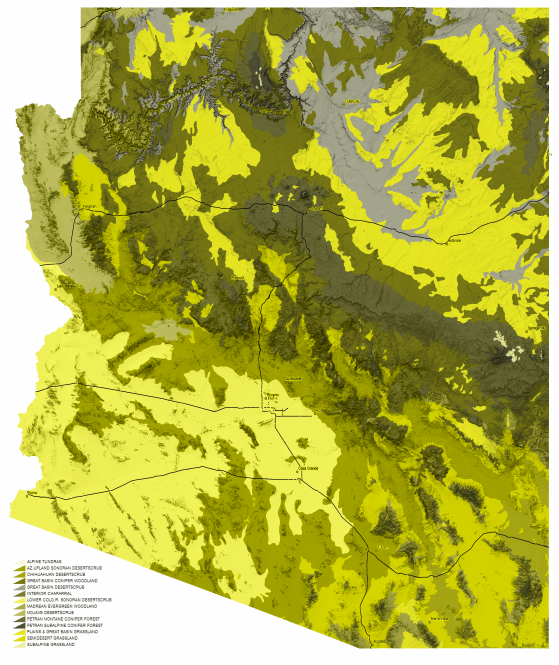
It’s fairly easy to distinguish between different vegetation biomes with this view. But with Deuteronopia, the most common form of color-blindness, it would look like this:
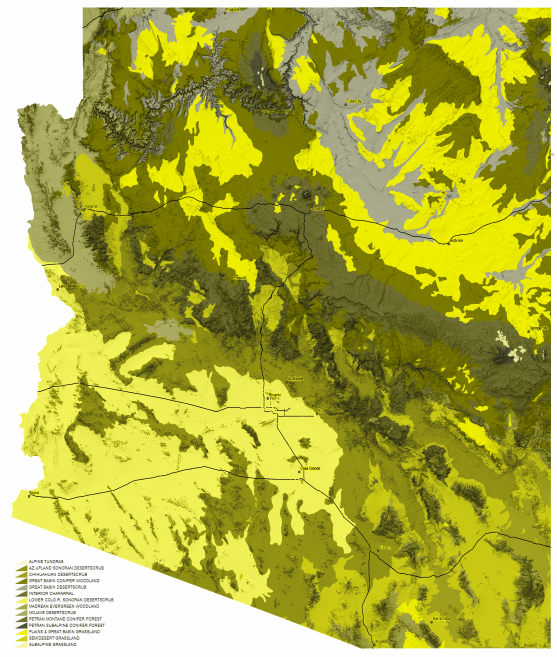
With Protanopia:
Finally, Tritanopia:
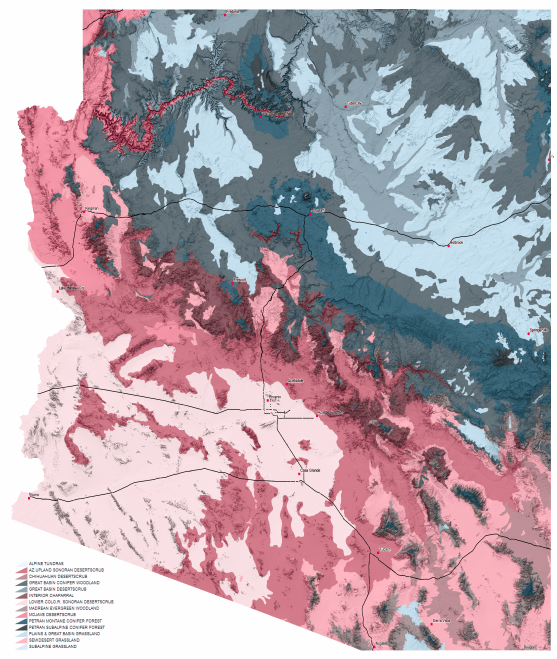
Only the last of those three color-blind versions, for Tritanopia, would be halfway-decent at allowing the viewer to discriminate different zones, but of course that’s the rarest form of color blindness. Something to keep in mind next time I do a map graphic, or for that matter a web page layout.
Random piece of trivia: Color blindness was first formally identified by John Dalton, the modern founder of the atomic theory, and is known in France as “le Daltonisme”.