Another slick brand-new tool from Zonums Software, the GE-Census Explorer lets you interactively display, plot and analyze US Census data in Google Earth.
The initial interface is deceptively simple:
![]()
Folder icon at left: “Get Dataset”. Lets you select the geographic extent of the dataset you want to look at:
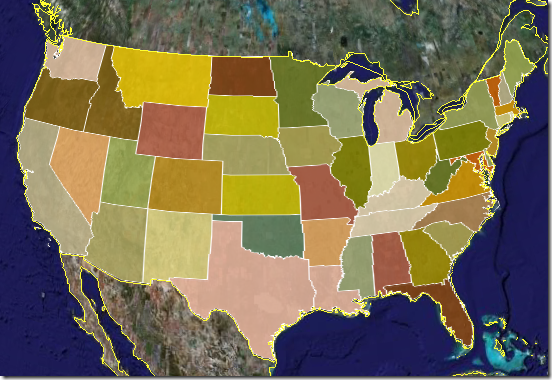
Next icon, the multi-colored points is “Symbology”, which lets you set the coloring for the geographic areas:
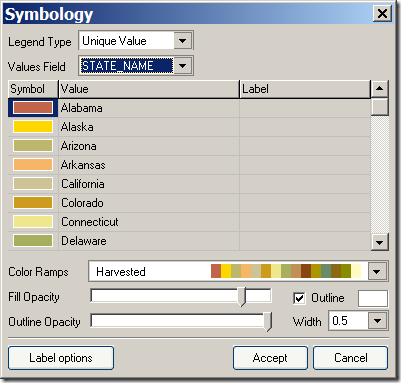
In this example, coloring US states (all screen shots from Google Earth):
The green cube is “3D Options”, letting you plot field data in different ways:
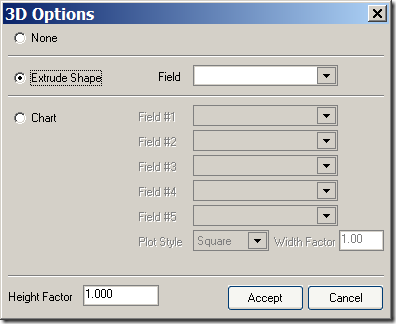
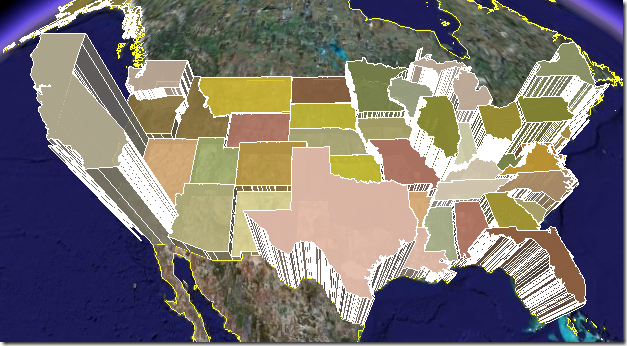
Selecting “Extrude Shape” with Field = 1997 state population, with a height factor of 0.5:
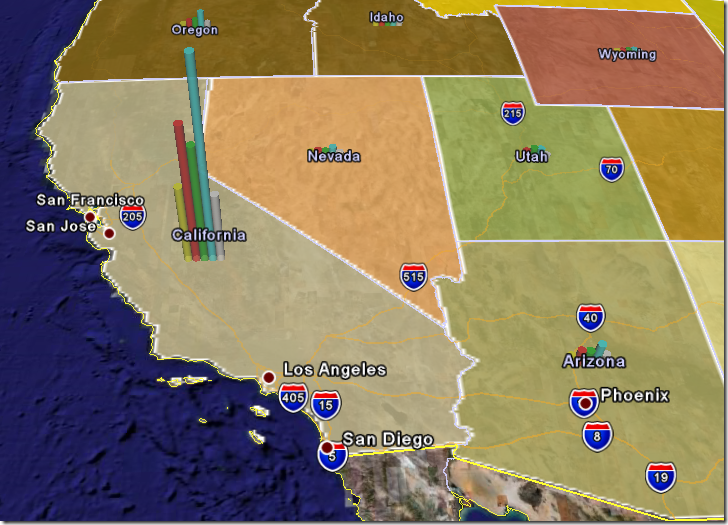
But you can also plot data as bar charts of different shapes, with height depending on data value, like this one for age-dependent population:
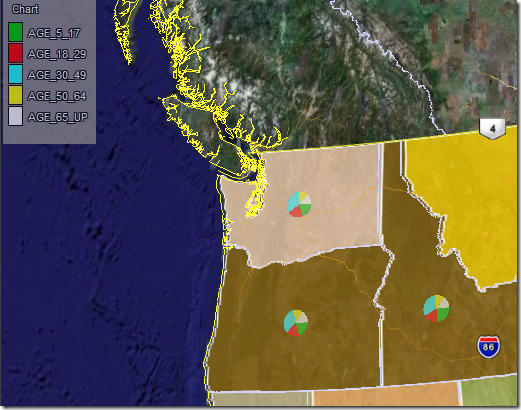
Or as a pie chart, with the legend at upper left:
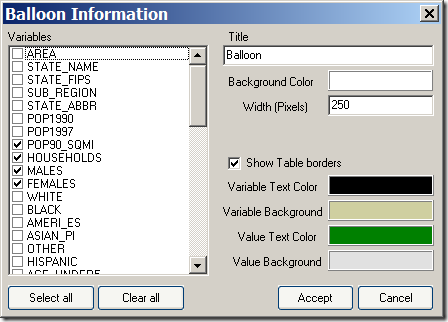
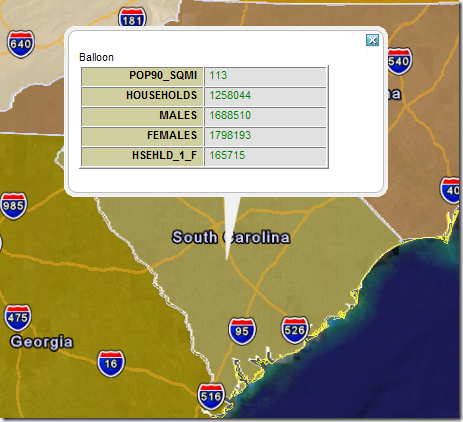
Next is “Balloon Information”, which lets you select the kinds of info that will show up in the balloon that pops up when you click on the geographic area name in the Places pane at right:
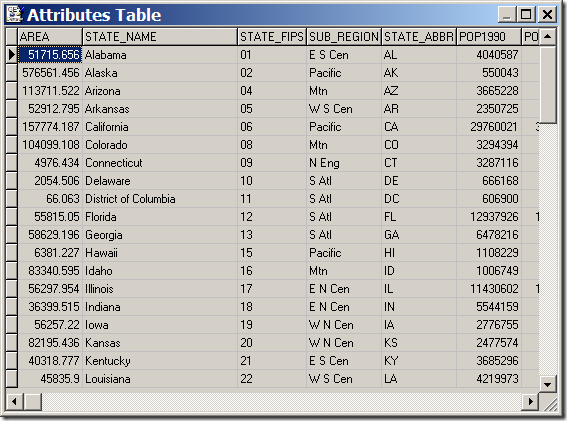
The “Attributes Table” icon brings up the full data table:
The next three symbols display and analyze the data independently of Google Earth. First is “Statistics”, the magnifier with the f-sub-x symbol, which brings up minimum, maximum, total, and average counts for any dataset. To the right of that, the symbol that looks like a bar chart, is “Histogram”, plotting the data in up to 15 different classes. Finally comes “Scatter Plot”, which lets you plot any dataset on the y-axis versus any other dataset on the x-axis.
The disk icon lets you “Export” the on-screen data in several formats:
- KML/KMZ – tells you to save the data by right-clicking on the “GE-Census Explorer” in the Places pane. This saves all the data on-screen, including the charts and legend.
- CSV or DBF format: Saves a full table of all the data, displayed or not.
- Shapefile: Saves the geographic areas in shapefile format, with a DBF table containing all the census data linked to it. This will take you to a web page where you can download the file. A handy way to get shapefiles of states, counties, and additional census subdivisions.
The program will leave lots of temp files in its directory when you’re done, but you can either leave them there or delete them without harm.
The GE-Census Explorer is a great complement to the gCensus and Census KML Data Visualization sites. I hope the author turns this into a more general purpose tool, where you can link your own data to the geographic areas and plot it in similar ways. The author is planning a web-based version, and also welcomes census datasets from other countries as well.