Among the highest quality DEM data you can get to go with a standard USGS 1:24K topo map is 10-meter SDTS DEM data, with heights specified to the nearest 0.1 meters (though the altitude accuracy of the DEM likely doesn’t warrant that resolution). I find it superior to the 10-meter NED data provided by the USGS Seamless Server, with fewer artifacts, although the SDTS format isn’t as well-supported as the DEM formats available at the Seamless Server. The SDTS DEMs are also in UTM NAD27, same as typical for USGS topo maps, versus the geographic projection for Seamless Server DEMs. There are a fair number of pay sites on the Web that offer these SDTS DEM files for a price, but there is one website where you can download them for free.
The GIS Data Depot has gone through some changes over the years, but is still around. It offers not just SDTS DEMs but a host of other GIS data, some free, other not free (you can often find the paid data for free elsewhere on the web). Data is classified as “statewide” or “countywide”, and you’ll find the SDTS DEMs in the “countywide” sections, listed in the Digital Elevation Models (DEM) – 24K section under the 1:24K topo map name whose area they cover (offered in both 10-meter and 30-meter resolutions) . The catch with the free “Normal” downloads is that they are at slower speeds than the paid “Premium” download (appears to be roughly 10 kilobytes per second or so).
Lifehacker posts about MapMyRide.com, a new workout-oriented Google Maps site:
- Display a USGS topo map in addition to the standard Google Maps views
- Measure distances
- Import a GPS track
- Create a route, export it to GPS or Google Earth format, annotate it with markers for parking, bathrooms, etc.
- Calculate the number of calories you’ll burn
- Save and track your data (requires registration)
Free, but lots of ads (the price you pay …). Some of the features (e.g. Map Settings, Workout Calculator) don’t seem to work in the Firefox browser, but work in Internet Explorer (Windows).
Back in 2005, EarthPlot software released several shareware tools for plotting data and creating graphic overlays in Google Earth. The most recent versions of their software are now available as freeware. If you’re interested in plotting spreadsheet data or creating annotated overlays in Google Earth, you should definitely check these out.
More after the fold …
Continue reading ‘EarthPlot Software Tools For Google Earth’
I’ve been meaning to write about these LIDAR Tools for a while, but since Google Earth Blog has just posted on their Google Earth visualization capabilities, I’ll jump in with my two cents. Posted by Martin Isenburg of the University of North Carolina – Chapel Hill, these tools allow quick conversion of LIDAR data into contour and DEM Google Earth KMZ files for “quick” basic visualization of the data. The process involves taking the original LIDAR data, simplifying it down a bit for contours, then converting it directly to either transparent contour overlays, or high-resolution DEM reflectance overlays. Here’s a screenshot of a set of contours from their showcase overlay gilmer.kmz (click on the image for a larger view):
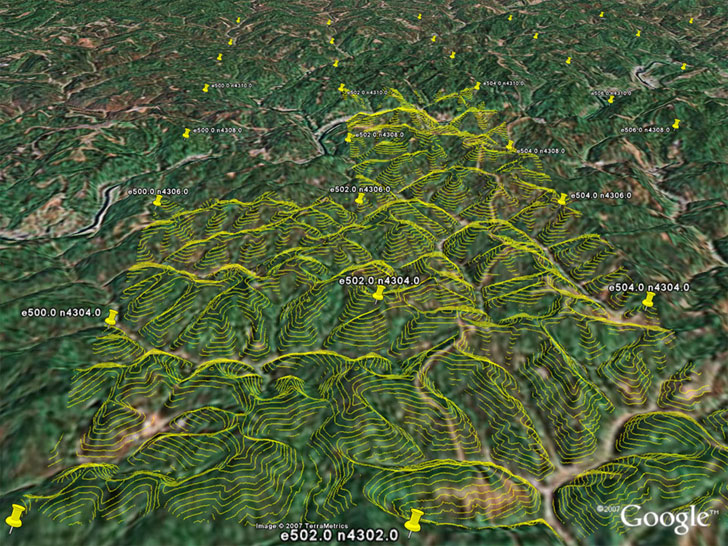
Note: To see the contours for a grid square, you’ll have to click on the placemark icon for a square, then click on the “load contours” link in the info balloon that pops up.
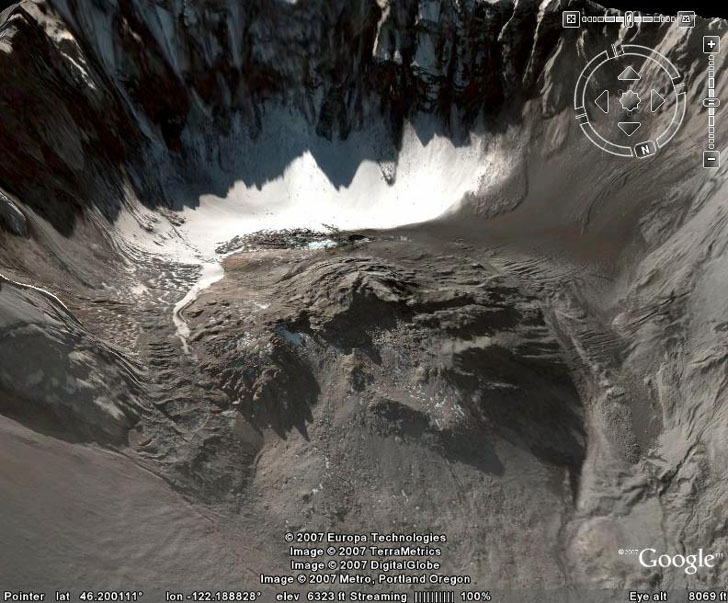
Here’s a screenshot of the interior of Mt. St. Helens from Google Earth:
And here’s the same view with the high-resolution LIDAR DEM reflectance view loaded in from the saint_helens.kmz file:
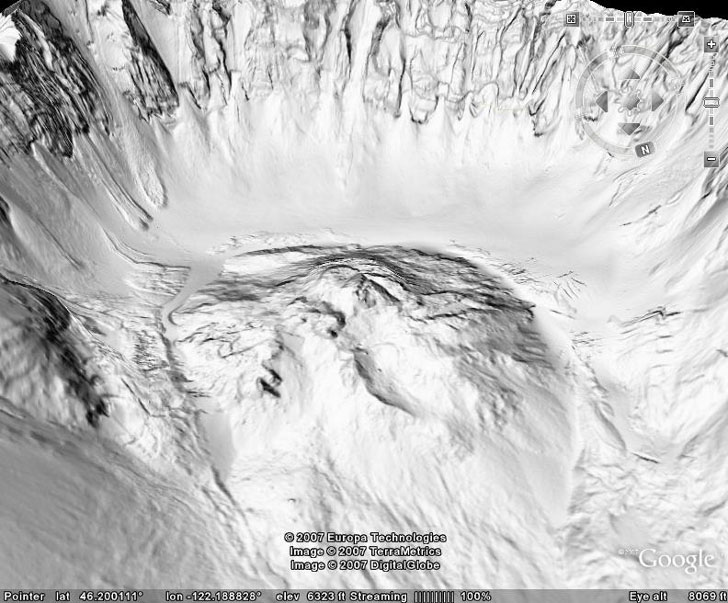
All the tools used to create these overlays are downloadable from the website; they’re all command-line tools (ouch), but there’s an example of usage given to make figuring them out a bit easier.
Also available are a basic set of LIDAR tools to:
- Convert text ASCII LIDAR data to the more efficient LAS format
- Print the LIDAR data
- View the LIDAR data
- Compress it losslessly
As a followup to yesterday’s post on the updates at “Hey What’s That”, I was going to post today about a pair of Google Mapplets created by Michael Kosowsky that allowed you to lay contour profiles on any Google Map, and also create terrain profiles. But Ogle Earth beat me to it; no use re-inventing the wheel. One minor correction: the preferred addresses for the mapplets are:
http://www.heywhatsthat.com/mapplets/contours.xml
and
http://www.heywhatsthat.com/mapplets/profiler.xml
Michael Kosowsky, one of the creators of the “Hey What’s That” site (for panoramas, viewsheds and peak identification in Google Maps and Google Earth) has sent out an email with some news:
- He gave a talk at Google about his website in early May, which you can view at Google Video
- Contour mapping at Hey What’s That, which was spotty before, is now improved; contours should be visible at every zoom level.
The Geolabels website offers another image option button for Google Maps, along with the standard Map, Satellite, and Hybrid buttons: Relief. This button gives you views of the terrain in an area, shaded by light at an angle and color.
Go to the website, and either zoom in on an area of interest, or enter the name of a populated place in the box at the upper left and click “Go” (if you hit “Enter” after typing in the name, you’re likely to get an error screen). At left, you will get a list of world localities in the database that match that name; click on one, and the map will zoom in on that location:
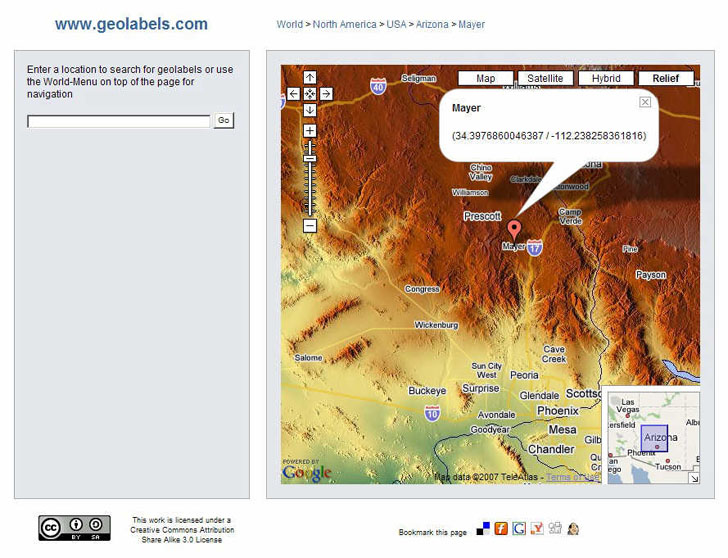
You will also get a marker at the location of the name you entered, along with a message box showing latitude and longitude to way too many decimal places. You can zoom in for a closer view:
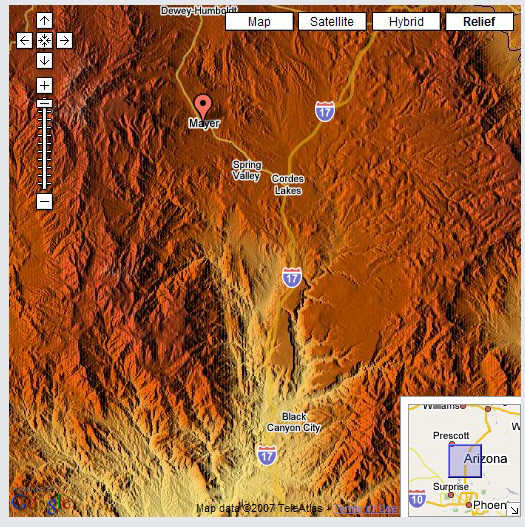
Or zoom out:
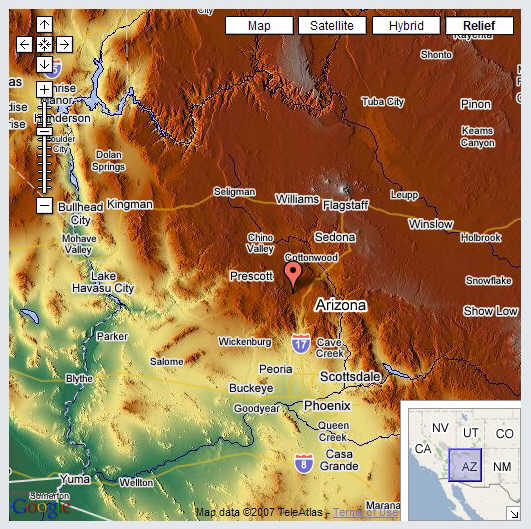
Major rivers and bodies of water, major highways, and populated places are also shown on the map. Keep in mind, though, that the color shading represents altitude, not vegetation, e.g. in the image above, all that green around Phoenix definitely doesn’t represent lush vegetation. Other sites offer contours or topo maps in the Google Maps interface, but the Geolabels website is a nice complement to them.
Modified 8/26/07 to update URL.
NASA’s Goddard Space Flight Center in Maryland maintains the Global Change Master Directory, one of the largest (if not *the* largest) collections of links to data I’ve found on the Internet, somewhere on the order of 15,000. While the header refers to “Earth science data and services”, it’s not limiting itself to the traditional definition of “Earth science” there (i.e. fields like geology, geophysics, meteorology, etc.).
The data is initially divided into 14 broad groupings:
Going to these pages, you’ll find the topics broken down further into subtopics, and even sub-sub-topics. For example, under Climate Indicators, you’ll find sub-topics for:
You can also search for data by map, date or location name. This is a “must-bookmark” data resource.


