Yeah, that’s not news to a lot of you, but it is to me. My last significant exposure to ESRI’s ArcGIS Explorer digital globe software (Windows only) was back when it came out, quite a few years ago. I tried it, and found it inferior to Google Earth in performance in 3D, and too complicated to bother learning it; since then, I’ve stuck strictly with Google Earth. A recent post on the free Garmin Tool application, which creates Garmin Custom Map overlays using ArcGIS Explorer, forced me to look at it again, and I was surprised to discover that it’s turned into a pretty cool, and pretty useful tool. Not perfect – the 3D performance is still pretty weak compared to Google Earth, and the out-of-the-box configuration isn’t as strong. But it has it’s own very strong set of features, and when used in 2D mode, is a good addition to any geography toolbox. Nice re-organization of tools/features in a MS-Word-like ribbon format, much better than the original interface.
- A good selection of basemap imagery sets, including Bing Maps (aerial/road/hybrid), general world imagery/topographic/road maps, OSM, general terrain shading and National Geographic shaded topo maps:
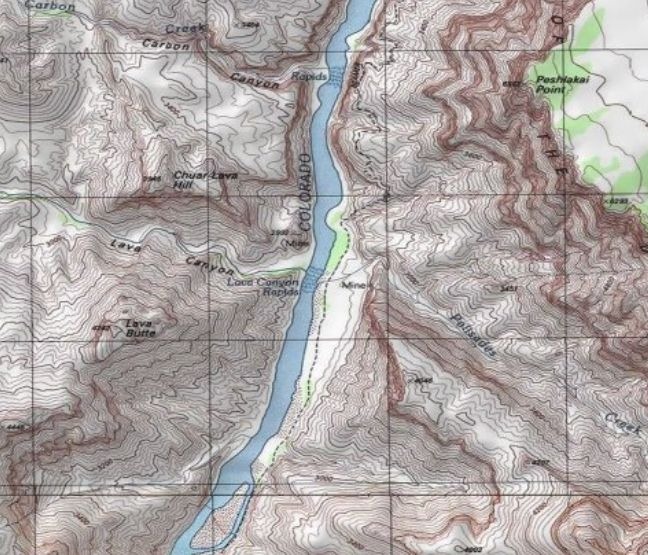
No vector basemap data, like the roads you’ll find in Google Earth.
- Add raster/vector data from multiple data sources and types: ArcGIS Online, GIS web services (ArcGIS servers, GeoRSS, WMS), ArcGIS lyr files, shapefiles, KML, GeoDatabases, text files, georeferenced raster imagery (e.g. GeoTiffs), and GPS data files (GPX).
- Vector editing tools: Point, Line Area, Circle, Rectangle.
- Export data in KML format (for user-created vector data), nmc map content packages for other ArcGIS Explorer users, or lpk layer files for ArcGIS.
- Driving directions/routing
- Add links to non-geographic data (documents, images)
- Measurement tools for distance/area
- Create a slide presentation by saving a series of map views
- Time/flight animations
Oh the “needs work” side:
- In the default install, I can’t find a way to set shapefile colors/sizes/symbols to depend on attribute values. For example, if you have an area shapefile with multiple subareas, each depicting an area with a separate property, they’re all displayed with the same color. For a GIS data viewer, this is a major missing feature. No selection/filtering by attribute either. The only way to view attribute data is through an on-screen pop-up; no tabular views of the DBF data.
- I initially thought there was no adjustable transparency for raster/vector layers, but it’s under the Appearance ribbon tab, instead of in the Properties window for each layer, which is where you’d normally expect to find it.
- Zoom and tilt controls are the opposite of every other digital globe I’ve used; scroll the mouse wheel away from you to zoom in, click the center button and move the mouse away from you to tilt the view to an oblique angle. And boy, can it be unresponsive sometimes in 3D mode! I usually only use the program in 2D mode only, so as not to have to deal with those issues.
- There’s a nice interface for querying/previewing datasets available in ArcGIS Online, but there’s no comparable gallery of pre-packaged content files (NMC/NMF files) anywhere on the ArcGIS website, at least that I could find.
- The app comes with the ability to add GIS-like analysis tools, as well as utilities like the Garmin Tool mentioned above (created with .Net and a free SDK kit from ESRI). By default, it comes with a buffer tool only; the process for adding additional tools isn’t explained very clearly in the help file. And while there’s a fair number of tools available, they’re hard to find; there doesn’t seem to be any systematic directory or catalog of them on the ArcGIS site. With some work, I tracked down some of them, and will post on them tomorrow.
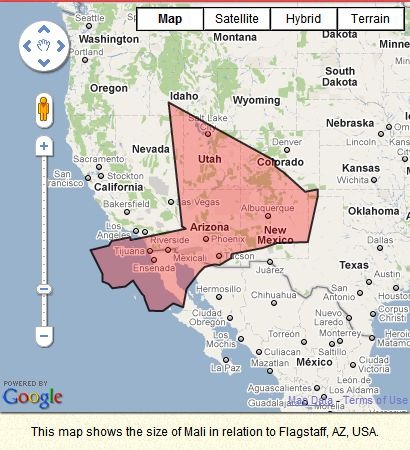
If It Were My Home plots the area of any world country of your choice on a Google Maps view centered around your current location (presumably determined by your IP address):
And gives a comparison of basic demographic characteristics between your country and the one you’ve chosen:

Clicking on any demographic parameter brings up a dropdown with more info:

There’s also a (usually too brief) summary of the country’s history, Amazon links to books, links to social network sites like Facebook for sharing, and a comments section. Oh, and usually some really incongruous ads.
Mapping America: Every City, Every Block, at the New York Times website, takes several limited subsets of US Census data and plots them across the whole country for every census tract (which is at the neighborhood scale for much of the US).
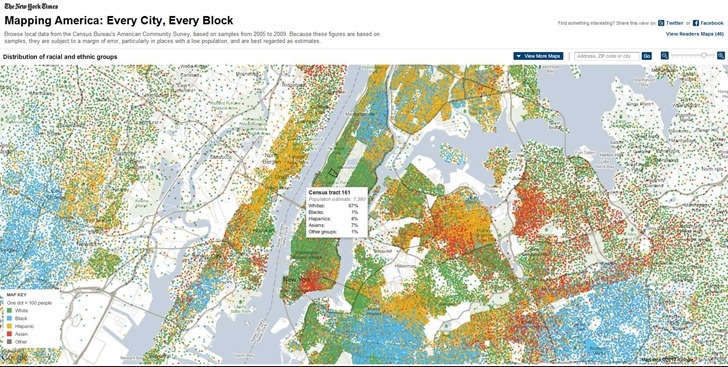
Pass the mouse cursor over the map, and data for every tract shows up in a pop-up window:
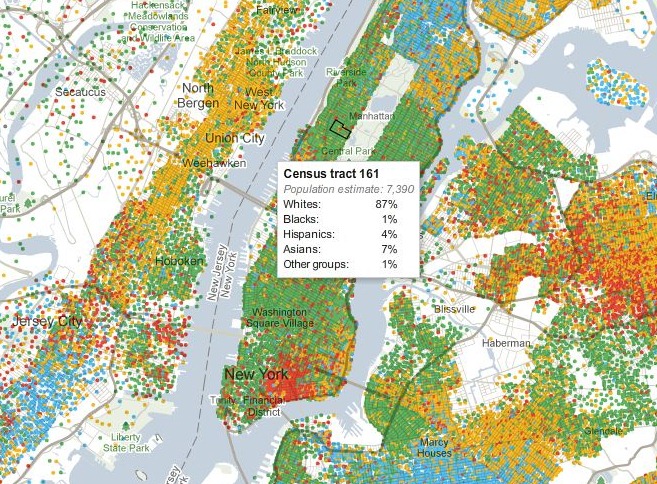
You can choose a limited number of map variants from the following categories:
- Race and Ethnicity
- Income
- Housing and Families
- Education
If you come up with a map that looks interesting, you can share it on Facebook or Twitter. No way to export map data, or map graphics (except with a screen capture).
GeoServer is …
an open source software server written in Java that allows users to share and edit geospatial data. Designed for interoperability, it publishes data from any major spatial data source using open standards.
GeoSolutions, an open-source consulting company, has created a free GeoServer workshop disc in iso format. You can run this iso in a free virtual machine environment like VirtualBox, or burn it on a DVD to use as a bootable Ubuntu Linux OS disc, or to install it on a computer. The disc contains:
- Tutorials on installing GeoServer, running it, adding data and querying it, and Google Earth/Maps support
- An installation of GeoServer with sample data
- Copies of the GIS programs uDIG and qGIS, which support creating datasets for use with GeoServer
OpenGeo, another consulting company, has also recently released the latest version of the Community Edition of their OpenGeo Suite. This is the free unsupported version, and includes not only GeoServer, but some additional tools: GeoWebCache, a web map caching app, and GeoExt, a “JavaScript library that provides a groundwork for creating rich web mapping applications”.
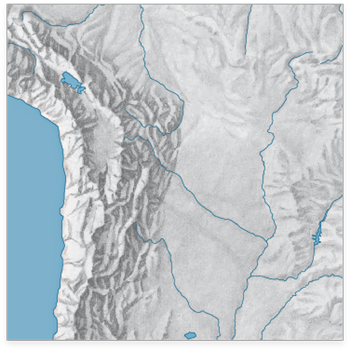
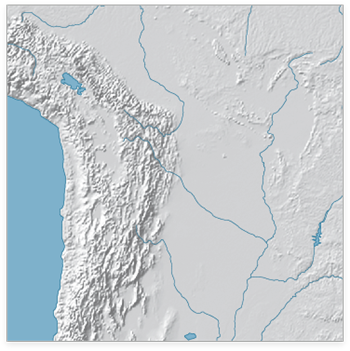
The WeoGeo blog highlights the Shaded Relief Archive, a collection of hand-shaded relief maps freely usable and distributable. This is a joint effort from Tom Patterson, creator/manager of the Natural Earth Data website (see this post for more info on the latter site), and Bernhard Jenny (author of the Terrain Bender and Scree Painter tools). While you can generate shaded relief from digital data (using reflectance), hand-shading can often do a better job of highlighting subtleties of terrain detail, as in this comparison of hand-shaded data (left) and digitally-derived data (right) taken from the Shaded Relief Archive comparison page:
Some maps come in georeferenced GeoTiff format (along with shapefiles that define map area and coastlines); others have yet to be georeferenced. Most are at fairly small scales, so they’ll be best for maps covering large areas; an exception is the set of 100+ shaded relief maps for US National Parks.
Note: Some of these shaded relief maps, as well as many others, are also available at the WeoGeo Market site.
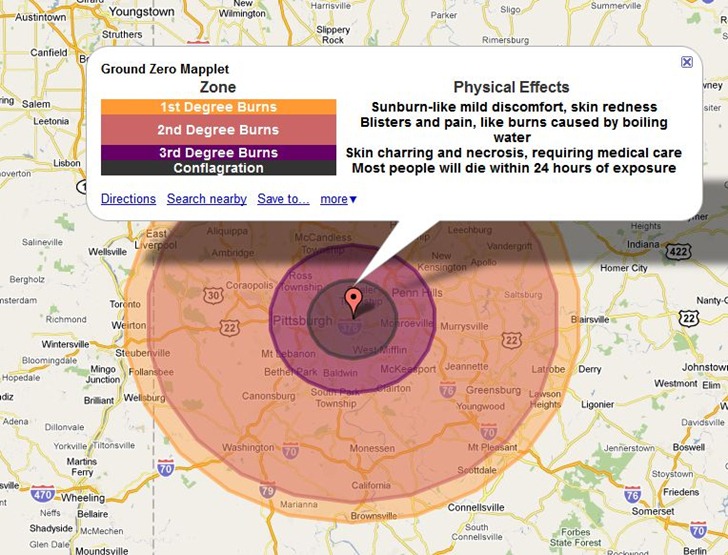
Bit of a grim app, but the CarlosLabs Ground Zero Mapplet will show the effects of various-sized nuclear weapons on a number of preset world cities. Here’s the impact on Pittsburgh of the “Tsar Bomba” blast, the most powerful nuclear weapon ever tested at 50 megatons:
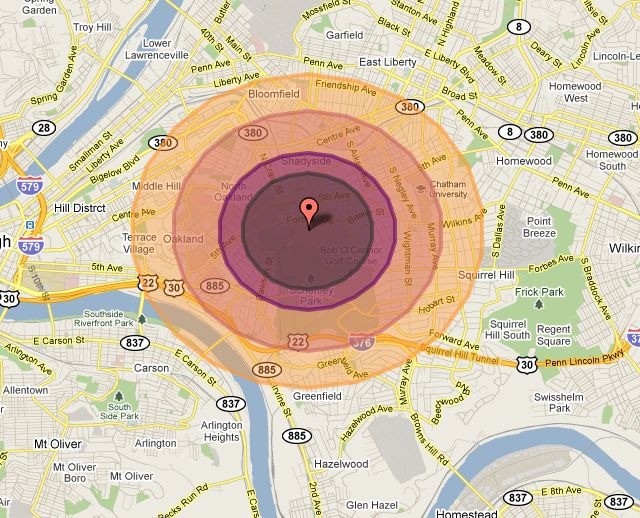
Most other blast options are for much less, like the 15 kiloton “Little Boy” dropped on Hiroshima:
But the largest explosion model available is an asteroid impact comparable to the Chixculub impact 65 million years ago that caused dinosaurs to go extinct:
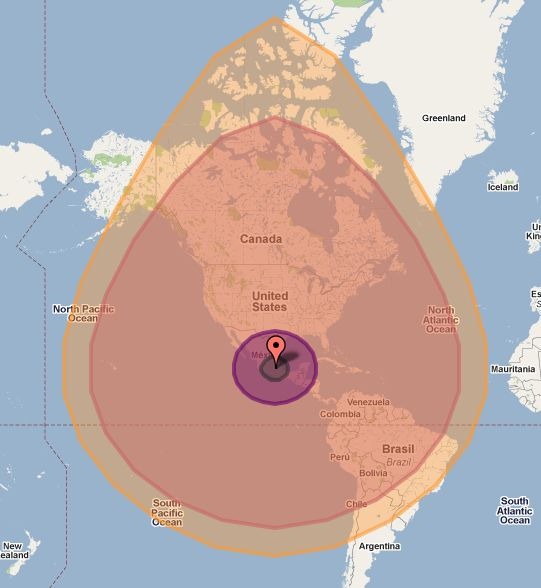
The main version is a Google Maps Mapplet, so you’ll need a Google account to use it in your My Maps collection. There’s a direct link to install it into My Map at the CarlosLab website. The Maps API link will take you to a page with embeddable code that lets you put a comparable app into your web page, like the live example below:
Unlike the Mapplet, the embedded app lets you select any location, but the overall map size is constrained. Source code for this app is available at the link above.
The Australian government’s GeoScience Australia website offers downloads of a wide variety of map and GIS data. There’s a web interface called MapConnect that you can try for selecting topographic and geology data for download and creating custom PDF maps:
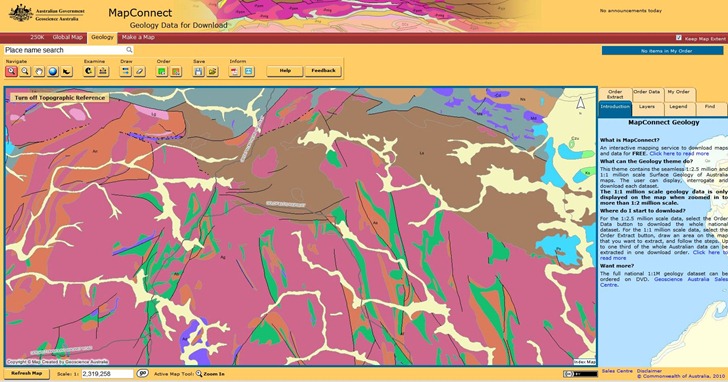
But I found it a bit confusing to navigate and use. You might do better to go to some of the other pages that let you browse and/or search for data, even though finding data this way may take a while.
Lots more to find, if you poke around the site for a while.
HT to m. bouchon.
The OpenTopography Portal is a GEON Project initiative to build an online system that provides integrated access to high-resolution topographic data, web-based processing tools, and enables the user community to share knowledge, experiences and resources
The OpenTopography Portal offers free downloads of LIDAR data in raw point cloud formats, processed DEMs, and Google Earth image overlays (reflectance):
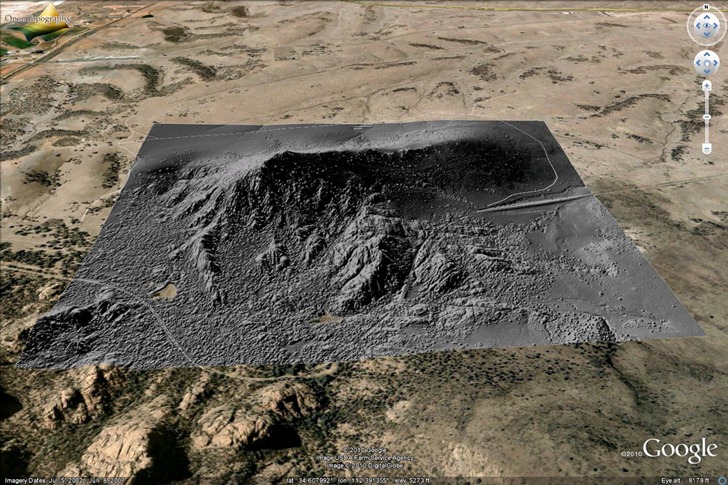
Data resolution is typically at least one meter, and sometimes better than that. Biggest problem with the site now is sparse area coverage; they’re relying on voluntary donations of data, and so far, the overwhelming majority of data is earthquake fault zones in California:
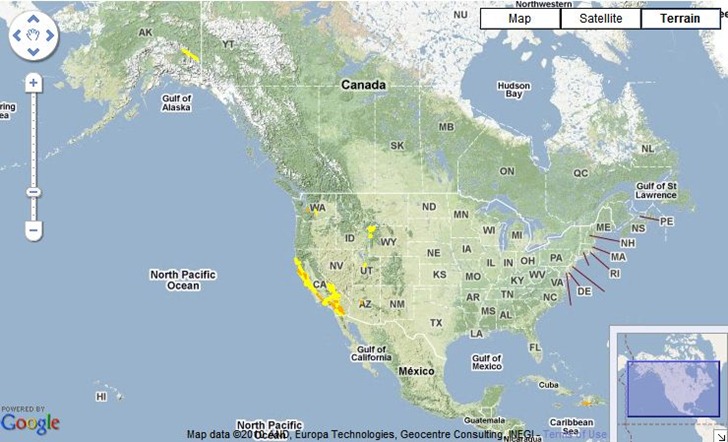
There’s a smattering of additional data for Alaska, Washington, Wyoming, Utah, Arizona and Haiti, but only a small fraction of the US is currently covered. The site/project is still active, so hopefully additional areas will be added in the near future. At the very least, it’s a useful site for getting sample LIDAR data to play around with.


