blankblank blank


Author Archive for Leszek Pawlowicz Page 7 of 79


Viewing And Analyzing NMEA GPS Data With VisualGPS

If you own an NMEA-capable GPS receiver, there are a substantial number of programs available for free that can monitor and display NMEA data. But my current program of choice is VisualGPS, because in addition to several commonly-found functions, it has one potentially very useful function that I haven’t found in any other similar program. Note: A version of VisualGPS with similar functionality is also available for Windows CE/Mobile devices.

After you’ve installed the Visual GPS program, started it up, and configured it to connect to your NMEA COM port (perhaps the one defined by XPort, described in yesterday’s post), you’ll have access to five function panels from the toolbar:

VGToolbar

From left to right:

Continue reading ‘Viewing And Analyzing NMEA GPS Data With VisualGPS’


Splitting A Single NMEA Serial GPS Connection Into Multiple Virtual NMEA Ports

If you have a GPS connected to your computer with a serial NMEA connection, either old-school (a hardwired serial port) or new-school (a wireless Bluetooth connection), the connection to the program you’re using to monitor the data is typically made through a single serial Windows COM port. Normally, if one program is accessing the NMEA data stream through this COM port, no other program can access that port at the same time; you’ll get an error message saying something like “Unable to open port” or “ “Port is already in use”. Which is a pain if you want to run multiple applications at the same time, and have each one receive the same GPS data. You could have multiple GPS receivers, each with its own COM port, but that can get expensive.

The donationware program XPort takes the input data from a single serial COM port, the one your NMEA GPS data is coming through, and lets you split the serial data stream between up to 8 user-designated COM ports. You can then have each application access a different COM port, so that at least  8 applications can receive, store, display, analyze, etc. the NMEA GPS data stream. And as it turns out, maybe even more than eight apps …

No installation required; just run the executable, and the program both puts an icon in the traybar, and opens up the program window:

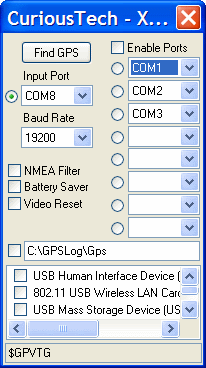
XPort

Here, I’ve already configured the program to connect to my Bluetooth GPS on COM port 8, and with my auto-connect feature enabled, it started up the Bluetooth connection to the GPS receiver automatically. If you don’t have this capability, you may have to manually establish the Bluetooth link between your GPS receiver and its assigned COM port, which can be a real pain (more below). The default serial speed for NMEA is 4800 baud, but I’ve found that sometimes setting it higher (19200 in this case) can improve reliability; other times, it has to be set at 4800 or it won’t work. In this case, clicking on the “Enable Ports” button starts splitting the COM8 input between COM ports 1, 2, and 3. You can select any COM port numbers unassigned by your system from COM1 to COM255, but some applications only let you choose from a limited set of preset COM port numbers.

It’s probably safest to connect each program you have running to a separate COM port. By accident, though, I discovered that at least under some circumstances, you can have more than one program accessing a single COM port. Unlike system COM ports, XPort won’t block access to a COM port already opened by another program. For example, I’ve had as many as 5 programs accessing data through the COM2 port with no apparent problems. Not sure what the limitations are on this, and it’s probably best to have each program have its own unique COM port. But if you ever have to run more than 8 programs that require GPS data, it may be possible just by having two programs share the same COM port for data.

For the checkboxes:

  • NMEA Filter: Filters noise and unneeded data. Haven’t seen this making a difference with my receiver.
  • Battery Saver: Keeps the hardware serial port closed until you enable the virtual ports. If you have a Bluetooth GPS receiver, this may save on battery use by keeping the Bluetooth connection off until absolutely necessary.
  • Video Reset: Turns the display off and on to keep the monitor from going into blanking/power-saving mode

The tray icon also changes color depending on the status of the GPS connection:

  • Black=Not Connected
  • Cyan=Connected-No data
  • Red=Connected/No Fix
  • Yellow=2D Fix
  • Green=3D Fix

The download page has additional technical data.

If you have a Garmin GPS unit that connects to a computer only via USB, it uses a proprietary Garmin protocol that is not NMEA-compatible. For those units, you might want to consider the paid utility program GPSGate from Franson. Note: Haven’t tried it myself, but have heard from others who swear by it. For $12.95, the express version converts the USB Garmin protocol into one or two virtual NMEA ports; the more expensive standard version lets you add even more virtual ports. Other functions include a Google Earth GPS connection interface, a conversion of NMEA serial data to the Garmin proprietary serial protocol, and a direct connection function to Bluetooth GPS devices to simplify the task of establishing a link between your computer and the Bluetooth GPS receiver. In my case, I struggled unsuccessfully for a while to get the standard Windows XP Bluetooth interface to work correctly with my Bluetooth GPS receiver before giving up and using the BlueSoleil Bluetooth manager that came with my Bluetooth dongle; if you run into similar problems with your system, GPSGate might be able to help.


Creating A Thematic Map Using Just Excel

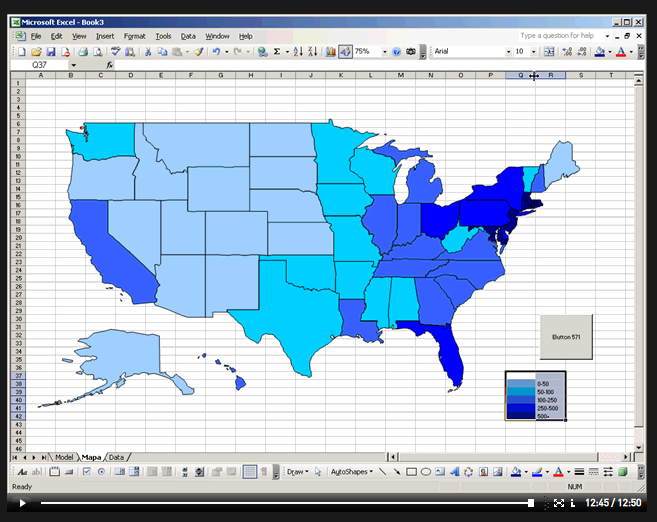
A video/demo tutorial on creating a thematic map using just Excel, no GIS or extra programs required. I’d rather use a GIS, but if you’re really comfortable with Excel, it’s worth a look. Note: Any time the video demo stops, it probably means it’s waiting for you to click on something on the screen, usually highlighted in blue.

excelthematic

HT to Askan Schmeisser.


Georeferencing A General Textual Location With BioGeomancer

In the good old days, before 1994 or so, when commercial handheld GPS units first came onto the market, locations were often described in general textual terms, like “28 miles NNW of Gila Bend”, or “5 kilometers east of Mount Whitney”. BioGeoMancer Classic and BioGeomancer Workbench can parse these kind of textual descriptions, and convert them to a set of geographic coordinates.

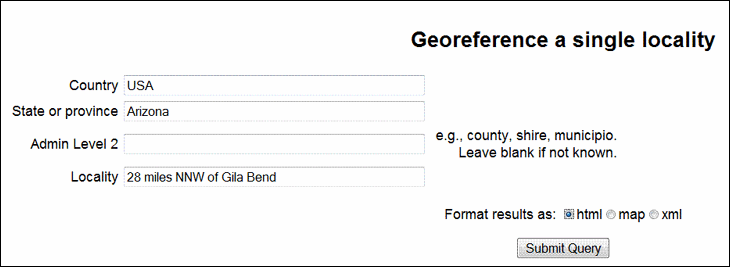
The older Classic version has a text-only interface with limited options:

classic

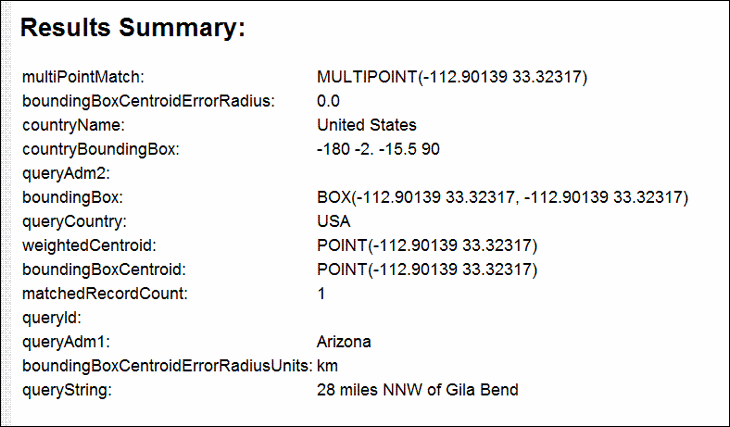
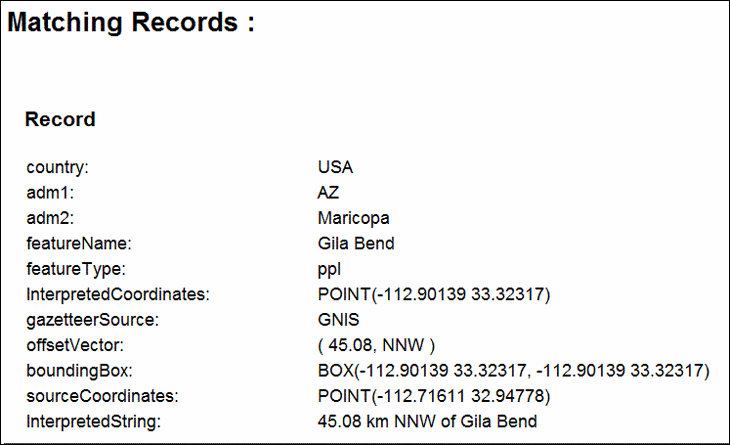
And gives a text output:

results

matching

The “Map” option in Classic doesn’t seem to work, but the XML option does. Since the Classic version is no longer under development, it’s likely to stay in this format

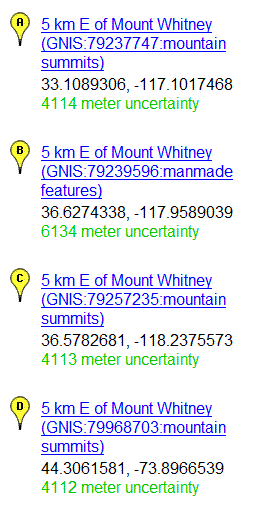
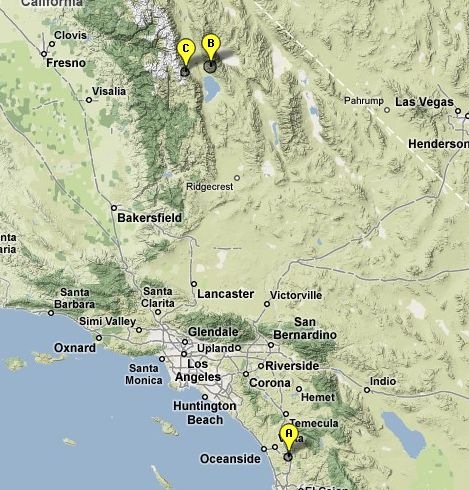
The newer BioGeomancer Workbench version, still under development, has a Google Maps based interface. Enter a locality like “5 kilometers east of Mount Whitney”, and get a list of localities with their locations plotted in Google Maps:

WhitneyList

In this case, I was looking for Mount Whitney in CA, but it came up with an additional one in NY. By using “5 kilometers east of Mount Whitney, CA” as the location reference, the NY locality would be dropped:

CAWhitney

The more general geographic info you can add, the better you will be able to narrow down the possibilities. It looks like you need commas to delimit geographic data, since “5 kilometers east of Mount Whitney CA” won’t return any results.

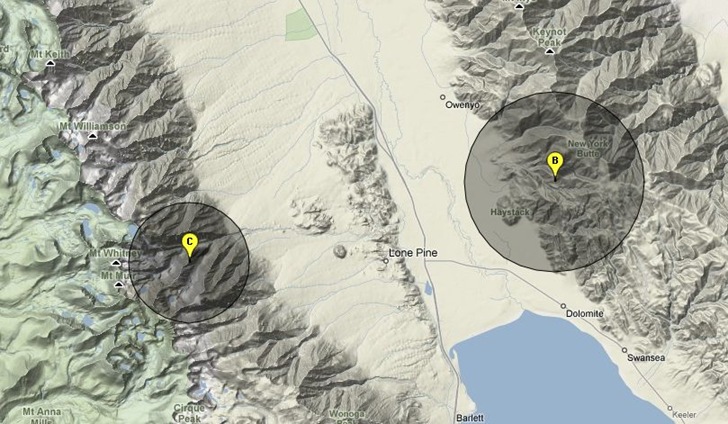
Zooming in on the northern localities shows them plotted, along with the location uncertainty as a darker circle:

closeup

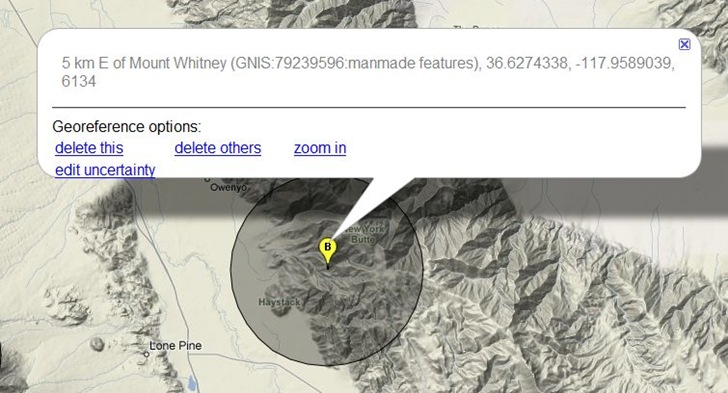
Clicking on a placemark brings up options to change the uncertainty radius, delete the placemark, delete all the other placemarks, or zoom in:

bgbubble

The only way to save the data now is to copy it from BioGeomancer and paste it into a different application. The help page indicates that in the future, you’ll have the option to save the data in spreadsheet format, and also do batch text georeferencing.


MapTool Goes To Version 2– Elevations, Areas, And Distances In Google Maps

I’ve covered Zonums Software free online application MapTool before; the original version let you determine the elevation of a point in a Google Maps interface, as well as measuring the length of a multi-segment path or drawn polygon, but not much more. Zonums has recently updated this application to  MapTool 2, which adds some really nice new functions (most accessible by clicking on the Options link at top):

  • Create vertices by manually entering coordinates, in addition to previous option of clicking on map (use Input link at the top for this)
  • Continuous coordinate read-out in both latitude/longitude and UTM
  • Divide a drawn line into equal parts by automatically adding equally-spaced vertices, or add vertices with a user-defined spacing
  • Convert a drawn polygon into a polyline, and vice versa
  • Edit individual vertices in a line or polygon
  • Get a count of the total number of vertices in the drawn feature
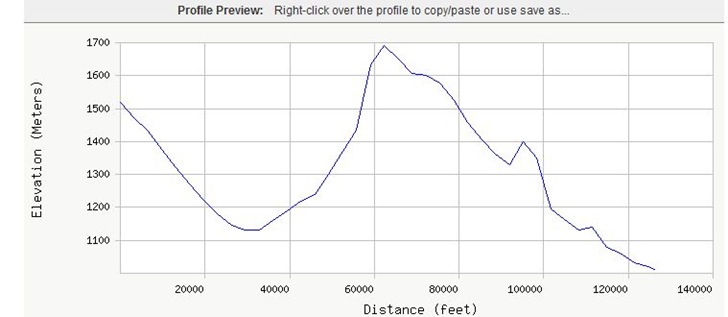
  • Get an elevation profile for all the vertices on a line

profile

  • Determine the extents (bounding box) for the drawn feature
  • Export the vertex coordinates as a text file
  • Export the line or polygon directly as a GPX, DXF or shapefile in latitude/longitude/WGS84, with the option to include vertex elevations


Curing Garmin Blue Flag Waypoint Disease

I’ve been asked this question twice already, which is good enough for me to write a post about it. If you use any of the color Garmin eTrex or GPSMap series, you’ll quickly discover that the default waypoint symbol, a blue flag, is pretty useless. It takes up a huge amount of screen space, and if you have multiple waypoints spaced closely together, it can become impossible to differentiate them. This is especially when the display is zoomed out to a lower scale:
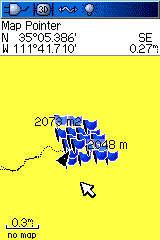
blueflagdisease

There are a number of ways to deal with this problem.

1. Set the waypoints zoom level so that they don’t appear until you’ve zoom in.

The default setting for waypoints to display is Auto, which usually means that they’ll show up at virtually every zoom level. But you can set a specific zoom level so that waypoints don’t appear until you reach that zoom. From Setup Map – Points:
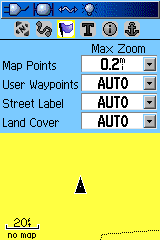
autowaypoints

Change the User Waypoints setting to the desired zoom level at which waypoints will first appear. E.g., the 800-ft. zoom:
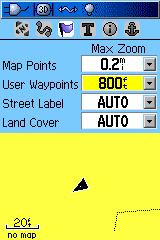
800ftzoom

Since you’re zoomed in closer to the waypoints when they show up, they’ll be spaced more widely. But if you actually want them visible when zoomed out to a lower scale, you’ll need to do something else.

2. Change the default waypoint symbol on the Garmin unit to something smaller.

When you create a new waypoint on your Garmin, the waypoint icon used is the same as the last one used. If you’ve never changed the waypoint icon, that will be a blue flag. You can change the waypoint icon in the waypoint creation screen by moving the yellow highlight box using the arrow keys:
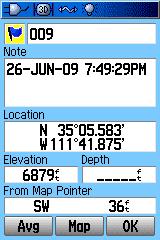
waypointhighlight

Then press Enter, and choose a smaller icon:
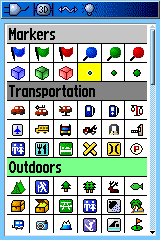
smallicon

I like the small green dot because it takes up far less display space than just about any other symbol. But you can choose any icon you want; or see my series on creating custom Garmin waypoint symbols if you want to design your own. Once you’ve selected a new waypoint symbol, it will be used for all subsequent waypoints you create on your Garmin.

3. Use MapSource to modify the waypoint icons.

Unfortunately, there’s no way on your Garmin GPS unit to bulk convert waypoint icon symbols created on your Garmin; you have to edit them on the unit one at a time. But if Garmin’s MapSource program (aka Trip and Waypoint Manager) came with your GPS or with a mapset you’ve purchased, you can easily do a symbol conversion, either one at a time or in bulk.

a. Use MapSource to download the waypoints from your GPS.

b. Click on the Waypoints tab to bring up a list of waypoints
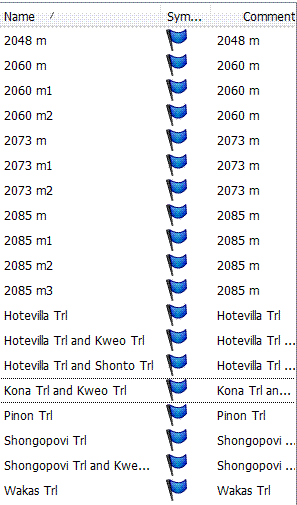
Waypoint list

c. To change the icon for a single waypoint, right-click on the waypoint in the list and choose Waypoint properties; or, from the map, right-click on a waypoint and choose Waypoint Properties. This brings up a dialog box with a icon symbol selection drop-down:
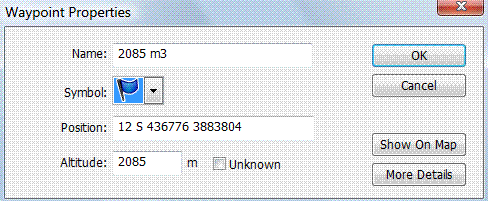
waypointproperties

d. To change the symbol for multiple waypoints, Ctrl-click on them in the Waypoint list; to select all the waypoints, click in the Waypoint list and then press Ctrl-A. Then right-click on any selected waypoint, and choose a symbol; your choice will be applied to all the waypoints. You can then save these waypoints in a file, or export them directly back to your GPS. For the latter, you might want first to delete the old waypoints with the undesired symbol; Garmin unit give you the option in the Waypoints listing screen to delete all waypoints that share the same symbol.

Having done this with the waypoints in the first image, converting them to green dots:
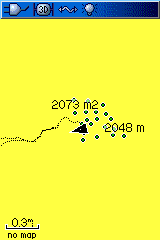
greendots

You can now differentiate different waypoints, where before they were a mass of indistinguishable blue flags.

This is also a useful technique to use when creating waypoints in a program that doesn’t support Garmin waypoint icons directly, like USAPhotoMaps; loading waypoints directly from a program like this into a Garmin GPS may result in Blue Flag Disease. Create the waypoints in this program, then save them as a GPX file and load them into MapSource. You can then use the above process to select your desired waypoint icons, and load them into the GPS.

4. Use GPS TrackMaker to modity the waypoint icons

If you don’t own MapSource, you can use the free program GPS Trackmaker to import waypoints from a Garmin, or from a GPX file, and then modify they waypoint icons. One at a time is easy – with the cursor in “Select data” mode (white arrow), move the cursor to near the waypoint until a black circle appears. Right-click on that black circle to bring up the Edit Waypoint window:
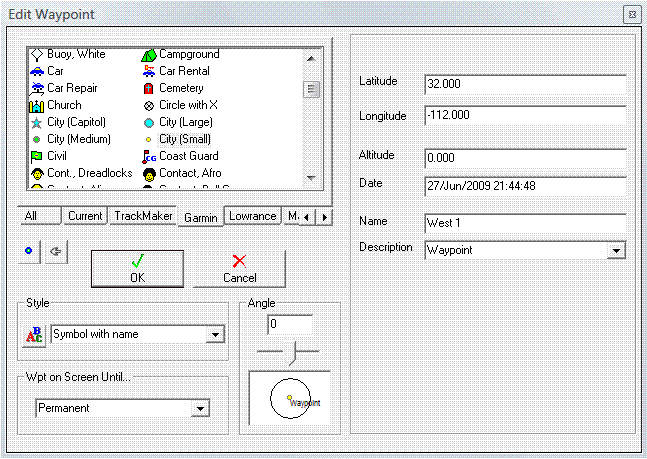
gpstm edit

Click on the Garmin tab to see only Garmin-compatible symbols, then choose a new symbol from the icons visible in the window. You can then upload the icons directly to your Garmin from the GPS menu, or save them as a GPX file.

Bulk conversion is also pretty easy. Use the Select data cursor to select all of the waypoints you want to change (click-and-drag to select a rectangular box). From the menu at top, select Tools => Waypoints =>  Change Selected Wpts … . A window similar to the one above will come up:
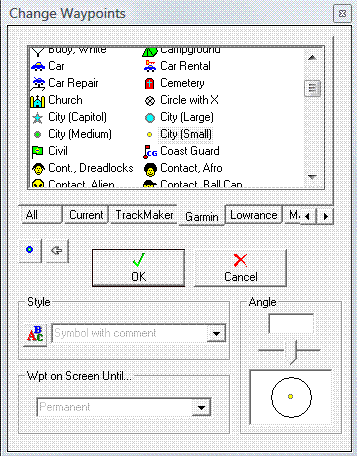
gpstm bulk

As before, choose the Garmin tab, then select the icon you want to use. Save it as a GPX file, or upload directly to your Garmin.


Convert From AutoCad Format To KML And Vice Versa With KML Tools Pro

I don’t have AutoCad, so I can’t try this out, but KML Tools Pro has AutoCad DVB macros that let you select features in AutoCad and convert them to Google Earth’s KML format; similarly, another macro will let you import a KML file into AutoCAD. From the website:

From AutoCad to Google Earth:

  • select objects and create .kml file
  • export points, lines, text, polygons (beta)
  • apply the icon of your choice
  • select zoom level that objects are visible
  • output automatically layer colors
  • adjust weight and transparency of objects

From Google Earth to AutoCad:

  • digitize points, lines, polygons in GEarth
  • save “.kml”
  • import in AutoCad using wanted projection

Supported projections:

  • NAD-83′ State Plane (*Alaska Zone 1 not supported)
  • UTM zones
  • HATT
  • Greek Grid (EGSA 87)

The current download site is in Greek, but the link to the downloadable file is obvious at the bottom. An older version of the page used to be available at this link, but isn’t currently working; you might try the cached version of the page from Google.

For converting KML files to DXF format, you can also try this online converter.


Map Maker Gratis: Free Map Editor

Map Maker Gratis is the free version of the professional $400 GIS and map editor Map Maker Pro. I’ve been meaning to try it out for a while, since even the free version has a very strong feature set. From the website:

  • Unlimited number of layers, raster and vector.
  • Colour, mono, and grey-scale bitmap backgrounds.
  • Large range of fill, line, and symbol styles
  • Translucent and semi-translucent fills.
  • Curved, stretched, and outline text.
  • Arrows, and dimensions.
  • Easy to create scale bars, north points, legends, text panels, inset images, etc.
  • Point-and-click to pop-up images, documents and internet links.
  • Print accurately scaled maps on any true Windows compatible printer.
  • Multi-sheet printing of large maps.
  • Create from new or import and edit.
  • Vector drawing and editing.
  • Intuitive cutting and joining of polygons.
  • Create polygons with islands.
  • Simple editing of common boundaries.
  • Numerous “snap-to” options.
  • Drag, stretch, rotate, duplicate groups of objects.
  • Create buffer zones.
  • Calibrate raster images.
  • Use data from DBF files to colour up a map or determine symbols.
  • Generate legends.
  • Measuring areas and lengths is simple.
  • Edit data sets.
  • Import vector data including ArcView SHP, MapInfo MIF, AutoCAD DXF, Idrisi VXP.
  • View BMP, TIF, Geo-Tiff,  and JPG raster data.
  • Export BMP, JPG, TIF.
  • Export DBF data to Microsoft Access, Excel, dBase etc.

The Pro version adds support for 3D, raster-to-vector, on-the-fly reprojection, export of vector features from the native .dra format to standard formats (shapefile, MapInfo, etc.),  and more; see the comparison chart for all the differences. And the install program lets you try out the Pro version for 30 days before it reverts to the free Gratis version. So it seemed worth a look on a simple map project I was doing for a friend as a favor.

Having struggled with the program for a few days, I can see that it does have many features; unfortunately, it also has a fairly steep learning curve, especially for those used to more conventional GIS programs. For example, modifying vector file display attributes isn’t done by modifying the layer properties, but rather by defining a “style”, a set of descriptions for things like symbol, line width, fill patterns and more, and figuring out how to do that effectively takes some work (and sometimes doesn’t work the way you expect). Getting labels to appear in the position I wanted was a chore, and some of the label controls didn’t seem to work. You can have multiple layers of vector data loaded, but it seems that you can only work with data in a single, “active” layer, i.e. you can’t edit or add points to layers other than the active layer.  There’s a large PDF manual that comes with the program, and at first glance it seemed to be comprehensive. But when I ran into problems and looked in the manual for answers, more often than not I couldn’t find them.

I suspect that if I worked long enough with the program, I would eventually figure out what it can and can’t do. There are some limited tutorials available for download at the site, along with links to tutorials by other users. Given the feature set, and the price point of $0 for the Gratis version, I can’t complain too much, and can see myself revisiting the program at some point in the future to give it a more complete review.

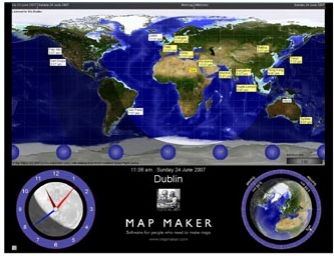
I should mention that the program authors generously offer free licenses for the Pro version to any non-profit organization, educational institution, or students in Africa. Also, there’s a world clock / sunlit area display program called Sun Clock available for a 30-day full-featured demo; at the end of 30 days, some features disappear (like views of the sky and stars), but the world clock /sunlit areas feature remains free.

SunClock