blankblank blank


Author Archive for Leszek Pawlowicz Page 37 of 79


Online Map Of US Thermal Springs

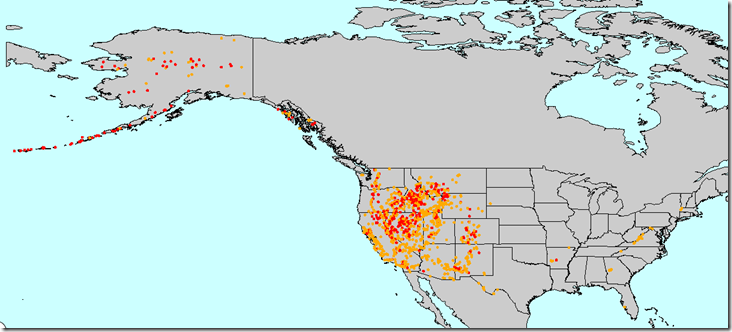
Living in the dry climate of the US Southwest, I’ve always found springs fascinating. For someone who grew up in the suburbs, water flowing continuously out of the ground with no pipeline or spigot somehow seems unnatural. But even more bizarre is hot water flowing out of the ground. NOAA’s National Geophysical Data Center has an online queryable map of Thermal Springs of the United States:

thermalsprings

“Thermal” doesn’t necessarily mean “hot”; the orange dots indicate water temperatures of 20C – 50C, while red dots run from 50C all the way up to boiling. But in all these cases, the water from the spring is elevated above what comes out of other nearby springs that aren’t heated geothermally. Most are concentrated in the more geologically-active western states, but with a few exceptions (most notably, the ones in Arkansas that include Hot Springs National Park). Using the “Identify” control to click on a thermal spring brings up its lat/long, water temperature, USGS quad, and more info.


Fixing "Broken" Shapefiles

Ever get an error message when opening a shapefile like, “Number of shapes does not match number of table records”? Yeah, well, neither have I. But if you ever do have such a problem, the Shape Checker utility might be able to rescue at least some, if not most of your data. It can re-generate a new .shx index file for your .shp file, add or delete lines to the .dbf file to match the number of shapes, and if your DBF file is totally hosed, can recreate a blank DBF for that shapefile. Not great, since you’ll lose whatever data you had in that datafile, but better than losing everything.

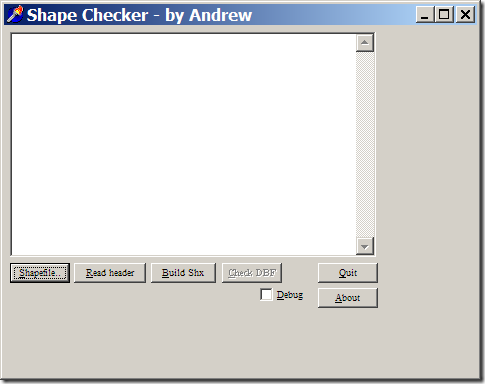
As the web page suggests, it’s probably best to do this on a copy of the corrupted file, rather than the original itself. Run the program:

shapechecker

Select the problematic .shp file with the left button, then recreate the .shx file with the “Build Shx” button. You can then check the DBF file for the proper number of records with the Check DBF button; if there are problems, or if the DBF file is missing, you’ll be given the option to fix it or create a blank one from scratch. I’ve tried it on point, line and polygon shapefiles I screwed up deliberately, and it worked as advertised. The program hasn’t been updated since 1999, but the author also provides the Delphi source code if you want to modify it yourself.


More Color Design Resources

A few more links to online resources to help with choosing colors for maps and related graphics:

Color.org – Upload your own graphic image, then select colors from it by moving your cursor over the graphic and clicking on a color block. Add colors to a color scheme, or find complementary colors. Interface is a bit confusing, though, and there’s no help file.

ColorSchemer – Click on a single color, or enter the RGB/Hex value, and get a set of 16 complementary colors.

Whatsitscolor – “Whats its color is an image-color processing utility that will evaluate an image and give you the image’s primary and complementary dominant colors of an image, how many visually unique colors are in an image, and the top ten visually unique colors in an image. Extremely useful when creating any type of designs around an image. The more colorful the image, the better the results. Results will display your image on the best suited background for that image.”

See some of the other posts on this blog about color tools (1, 2, 3).

Via Lifehacker.


Converting Digital Elevation Models To Shapefile/DXF Contours

There are any number of ways to convert a digital elevation model (DEM) to shapefile vector contour lines, but most of the ones I’ve come across have had limitations of one sort or another. The best solution I’ve come across is the free program dem2topo; while it only supports a limited number of DEM formats, it has more flexibility in units and simplification than other methods, and the graphical interface is easy to use (unlike some command-line programs).

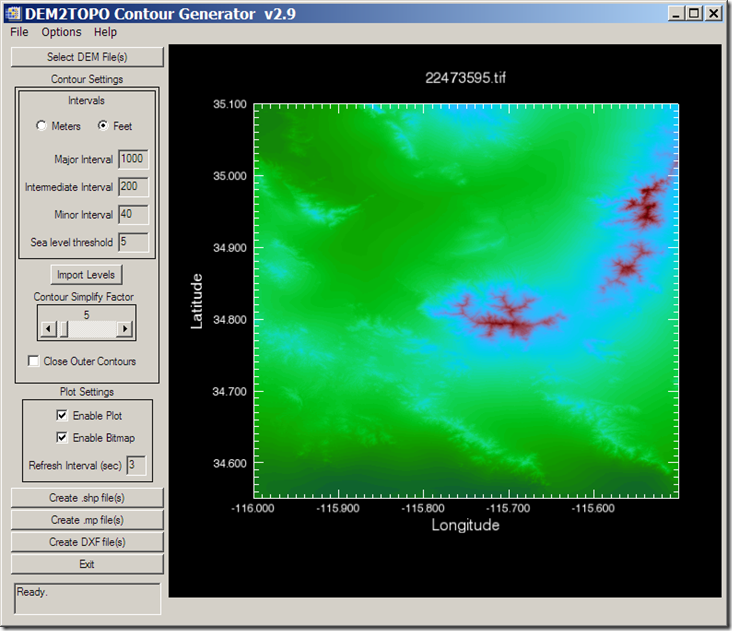
The program is written in IDL, an interpreted language, and you’ll have to download and install the IDL Virtual Machine first (free, but a 100 MB download, requires registration, and you may get a sales call). DEM formats supported are Canadian Digital Elevation Data (CDED), and nominally the GeoTiff format, but I’ve had some GeoTiff DEM rejected by the program for unknown reasons. NED GeoTiffs from the USGS Seamless Server work fine, and if you can open your DEM in the program 3DEM (which supports a number of DEM formats) and export it as a GeoTiff DEM from there, those should work with dem2topo as well. Once you’ve loaded your DEM into dem2topo:
11-24-2007-8.02.08 PM11-24-2007-8.03.14 PM12-15-2007-11.09.23 PM

you can choose contour intervals (meters or feet, regardless of what the original units were), the simplification factor (larger simplifies more, but at the cost of detail), whether to close the outer contours, and whether to display the contours as they’re being processed (for faster processing speed, leave these unchecked. More on these options is available in the helpfile.

Once configured, you have the option of converting the DEM into either shapefile contours, DXF contours, or into the .mp format used in creating maps for Garmin GPS units. For the shapefile format, major/intermediate/minor contour intervals are defined in the DBF file by the same hex code used in the .mp format: 0x0020 for minor contours, 0x0021 for intermediate, and 0x0022 for major . Processing speed will depend on the size of the DEM and level of detail, but don’t expect instant results. Converting the above 10-meter DEM to shapefile contours took well over an hour, albeit on my fairly pokey 2.4 GHz system; more memory also speeds up the process. But the results are worth the time; here’s a blow-up of the shapefile contour map of a very small section of this DEM:
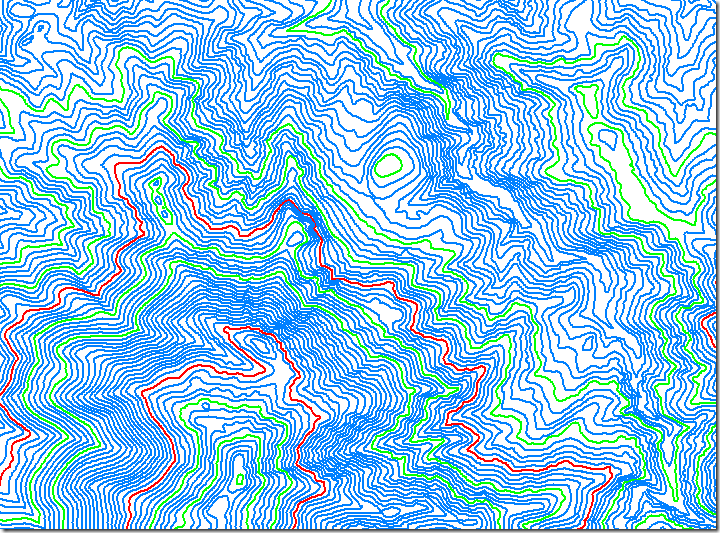
contours

A simple process, and if you run into problems, the help file is well done.


GeoSetter: The Best Free Photo Geotagging App?

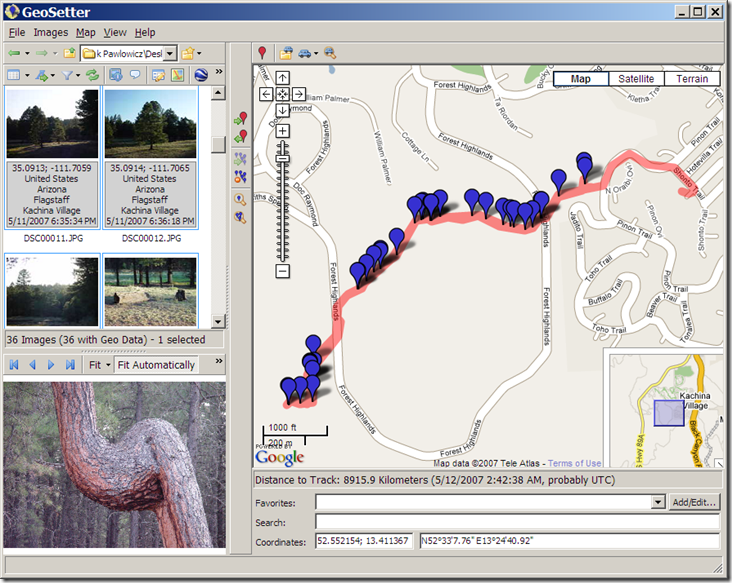
I’ve posted about a fair number of applications for geotagging photographs, embedding the geographic location into the photo’s EXIF header either manually or by synchronizing the time the photographs were taken with a GPS GPX track file. So far, my favorites have been GPicSync and Location Stamper, but GeoSetter is my new program of choice. Among its features are:

  • A convenient and easy to use photo album display and Google Maps interface

11-24-2007-8.02.08 PM11-24-2007-8.03.14 PM12-15-2007-10.51.10 PM

  • Automated geotagging of photos with a GPX, NMEA, PLT or Sony LOG track, with adjustable time zone and time matching tolerance
  • Synchronize untagged photos with geotagged photos taken at the same time/place
  • Display of the track and position markers for the photo in a Google Maps window
  • Automatic retrieval of the geographic location of a photo (e.g. the name of the nearest city, state and country) for embedding in the photo’s IPTC header
  • The ability to manually edit the photo’s header, including not just the geographic data, but also the IPTC source/description, category/keywords, etc.
  • You can also manually geotag a photo by creating a marker in the Google Maps interface, then associating that marker with the photo
  • Export of selected photos to a Google Earth KML file, with or without the track file. While other programs have this capability, GeoSetter lets you also export your choice of any of the EXIF/IPTC header data associated with the photo to the KML file as well.
  • Undo/Redo capability
  • Eight different languages
  • Unlike some of the other programs I’ve posted about, GeoSetter’s geotagging is recognized by Picasa

The biggest flaw with the program is the lack of a help file (a few functions are documented on the website), but the program is so easy to use, you won’t miss it that much.

Thanks to Robert Kluszczynski for letting me know about GeoSetter.


GPS "Dilution Of Precision" (DOP) Maps

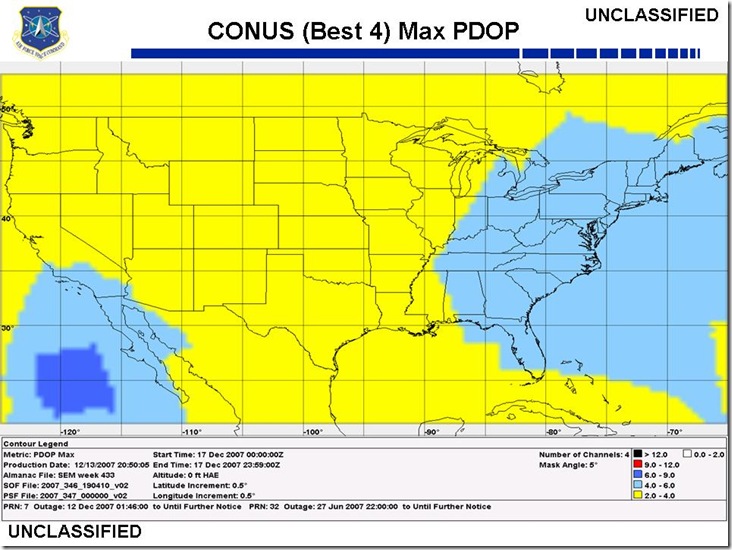
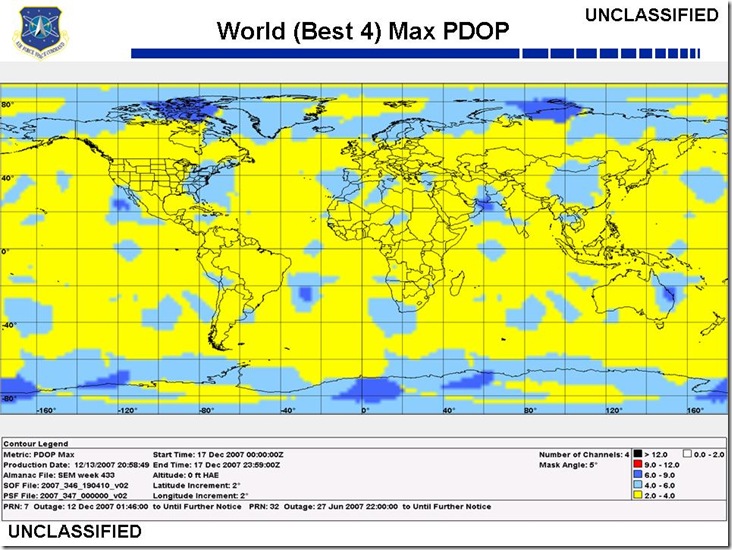
One of the principal factors affecting GPS accuracy is the satellite geometry, or how far apart in the sky are the visible GPS satellites. If spaced widely across the sky, you can get a more accurate determination of your position by trilateration than if they are “clumped” together. A measure of this geometric accuracy factor is the Dilution of Precision, or DOP; the lower the DOP, the more accurate your GPS position is likely to be (though there are many other factors that affect GPS accuracy beyond satellite geometry). Some more expensive GPS receivers can calculate and display DOP in the field, but most consumer-grade units don’t explicitly give the DOP, but factor it into their error estimates.

I’ve posted before about free programs from Trimble and Magellan that will calculate the DOP for any location at any time, and plot it over the course of a single day. But if all you want is a general indication of what the worst DOP at a specific location over the course of a day will be, or what it was in the past, the US Air Force’s GPS Operations Center publishes maps of both the continental United States and the world showing what the highest DOP (corresponding to the lowest accuracy) will be over a specified 24-hour period (click on the Performance Reports link near the top).

uclas_conus_dop

uclas_world_dop

The default map is for three days in the future, which is also the latest date available. But you can get maps for previous days, and one/two days in the future, in the Archived Reports section. The site also offers advisories about the current status of the GPS system, a FAQ, and useful links.


A Good Introduction To Geospatial Data Analysis

Jeff at Vector One asks, “Why is there so little geospatial analysis?” I can think of any number of possible reasons:

  • People aren’t aware of it, or what it can do; for some people, geographic analysis ends when you put a point on a map
  • It can involve advanced analytical and statistical techniques that are challenging to learn
  • Commercial software can be expensive, and difficult to learn; ArcGIS’s Spatial Analyst and Geostatistical Analyst extensions list at $2500 apiece.

While there are many freeware programs available for geospatial data analysis (I’ll post on some of them on the future), there’s one program I’d select as the best choice to address the above issues: GeoDA, spearheaded by Luc Anselin at Arizona State University. And that’s as much for its teaching materials and documentation as it is for its capabilities. There’s a 100+-page user’s guide, a 200+-page workbook that’s a mini-course on analyzing spatial data, multiple publications, dozens of sample datasets, even a QuickTime movie. It’s by no means complete; for example, there’s no geostatistical interpolation capabilities in this program (e.g. variograms, Kriging). But just by itself, it’s a great introduction to many techniques for analyzing spatial data correlation. It’s only for Windows now, but they’re working on a cross-platform open source port for Windows, Linux and Mac; no word on when that might become available.


Google Maps Search Interface For Garmin .img Maps

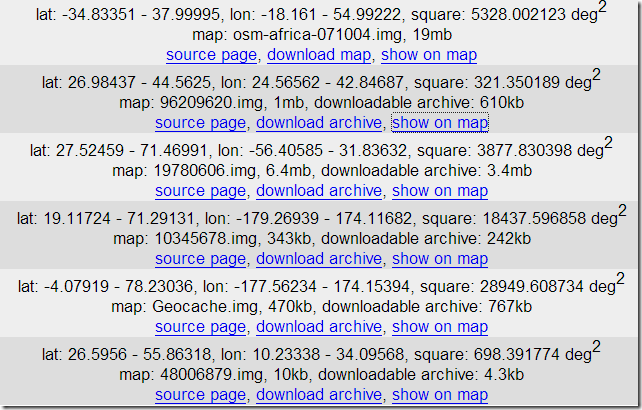
In a previous post, I listed off a few sources of free .img maps that can be uploaded to a Garmin GPS unit; GPS Tracklog recently posted a few more as well. There’s a new site called GPS MapSearch that makes the process of locating these maps a lot easier, using a Google Maps interface. Click on a point in Google Maps, and a list of Garmin-compatible .img maps for that area will appear in the right text box:

11-24-2007-8.02.08 PM11-24-2007-8.03.14 PM12-14-2007-8.37.54 AM

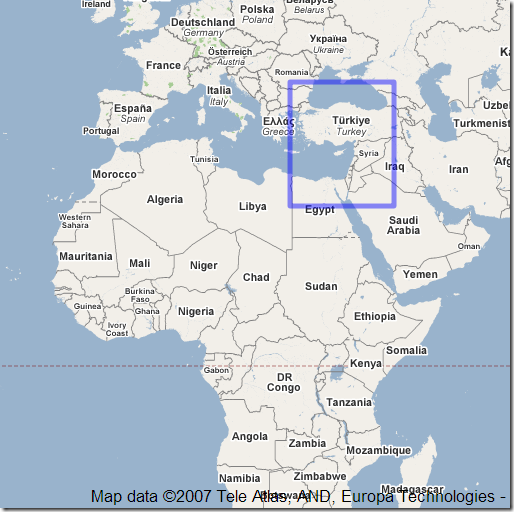
listing the geographic extents, with links to the original web page and the downloadable map file. Click on “show on map”, and the extents covered by that particular map will be displayed in the Google Maps interface:

11-24-2007-8.02.08 PM11-24-2007-8.03.14 PM12-14-2007-8.41.02 AM

Area coverage, level of detail, and quality of data are likely to vary widely, and it looks like some of the maps sources listed above aren’t included (the author is soliciting that data, so that may change). But it’s still a really nice tool to have, especially if you’re looking for Garmin .img maps in areas that aren’t covered by commercial products. Once you have a .img map, you can easily add it to your MapSource dropdown list using Mapset Toolkit.