I’ve been waiting for LandSerf 2.3 to officially come out of beta before posting on it, and that finally happened about a month ago. LandSerf is a Java-based GIS program with:
- Terrain visualization and analysis functions (its primary focus)
- Some vector functionality related to terrain analysis, plus other basic vector functions
- GPS and Google Earth utilities
Today, I’ll walk through some of LandSerf’s basic terrain visualization and analysis functions; upcoming posts will deal with the vector and GPS/Google Earth capabilities.
Since LandSerf is Java-based, it’s platform-independent, and runs in a similar fashion for Windows, Mac and Linux; on the downside, this means that some operations will run more than just a bit on the slow side. LandSerf supports more than a dozen elevation formats, including .grd, .asc, DTED, .bil and .dem. Disappointingly, it doesn’t support GeoTiff DEM files; it will import GeoTiff images, as well as JPG, GIF and PNG files if they have a matching worldfile for georeferencing. Open a file with the File => Open command, then select the filetype you want from the dropdown:
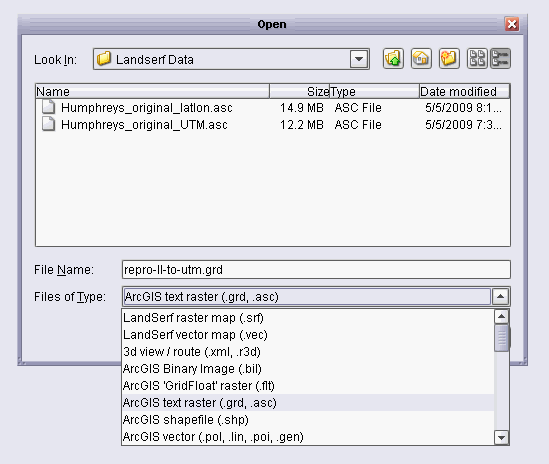
Elevation, graphic and vector formats are mixed up in the list, and the alphabetizing of the list isn’t optimal (e.g. shapefiles aren’t listed under “S”, but “A” for ArcGIS shapefile); it takes a while to find the right format.
Here, I’ve loaded an ArcGIS text raster (.grd, .asc):
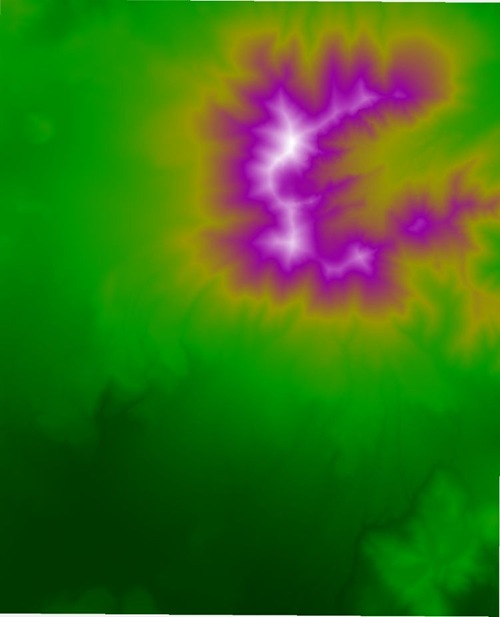
The main program display area will show the file data (here with the default of elevation colors), and there will be a corresponding data thumbnail at left:

As you add data layers, either by opening a new data file or generating a derivative data set from raster or vector data, new data thumbnails will show up at the left. You select the primary data to display by clicking once on the corresponding thumbnail to turn it gray, then clicking Control-R to refresh the display and display that dataset; you can also select a secondary set of data for some operations by right-clicking on the thumbnail to turn it pink. Memorize that Ctrl-R command, since you’ll be using it a lot; the intuitive approach to selecting and displaying a dataset, double-clicking on it, brings up a window to edit the data display properties. Other quirks include an odd zoom function that uses mouse/mouse wheel movements to zoom in and out; sometimes, the mouse wheel will only zoom out. Unlike other GIS programs, there’s no button to put you into pan mode with the left mouse button, but right-clicking or mouse-wheel-clicking on the map display combined with dragging will let you pan when you’re in zoom mode.
LandSerf will use a raster file’s georeferencing data, but won’t automatically assign a coordinate system to it; you have to do this manually by double-clicking on the thumbnail to open the edit window:
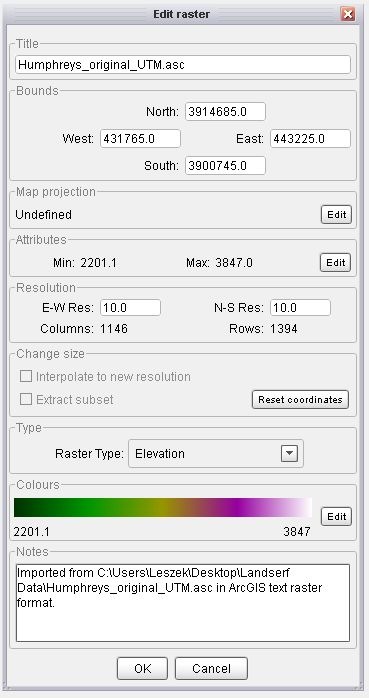
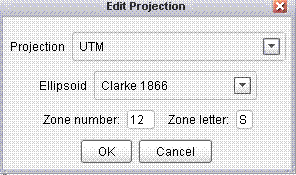
Then clicking on the Edit button in the Map projection section, and specifying the coordinate system used by the original data file:
This is also the window used to modify raster or vector coloring schemes.
As I discovered, you have to make sure to enter all of the requested information, including Zone letter for UTM; otherwise, the coordinate system may be off, especially after re-projection.
It’s pretty much required that all the datasets you use in LandSerf for analysis and combination be in the same coordinate system. Once you’ve set the original data’s coordinate system, there’s a function to re-project it to one of 8 different coordinate systems using the Transform => Reproject; these include UTM, Swiss National Grid, OS National Grid, French NTF National Grid, and several Albers equal area projections for North America. Datum is always WGS84 after re-projection.
In this example, reprojecting the UTM DEM to latitude/longitude will create a new DEM dataset for the new coordinate system:
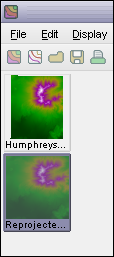
But I’ve found some problems with LandSerf’s coordinate re-projection function, at least for my test data, which limit its use as a general-purpose re-projection and/or format conversion utility. If I re-project the data, save it, and then view it in a GIS data viewer like Global Mapper or the TatukGIS Viewer, there can be shifts in coordinate system that range from minor to major. What’s more, the deviation can change depending on what format you choose to save it in – for the DEM, I got different results for .grd, .flt and .bil formats, with .bil being the closest to the original data. But even there, the positions were shifted about 100 meters east/west, and I got similar results when saving raster images of the displayed data. These problems do *not* occur when you save data in its original coordinate system, not re-projected, so you can save the original data or derivatives of it in whatever format you want, and won’t see this problem. So to avoid problems, have all datasets loaded into LandSerf be in the same coordinate system.
Also, when saving images, the default format is GIF; to save an image in a different format like JPG or PNG, you’ll have to manually specify the file extension. And even though the program can open TIF files, and .tif is listed as a valid extension when saving an image, the program will not save images in that format. When saving an image, a worldfile will be generated with the correct extension for the saved file’s format (e.g. .jgw for JPG files).
To close a dataset, left-click on it to select it, and then choose File => Close raster (or vector) from the menu. One of the minuses of LandSerf is that it doesn’t take advantage of right-click (or Command-click for Macs) for basic operations like closing datasets, choosing operations, etc.. There is a toolbar at the top, but even that is somewhat limited in the options it offers.
With DEM data loaded, you can perform a number of DEM analyses or visualizations:
- Elevation
- Slope
- Aspect
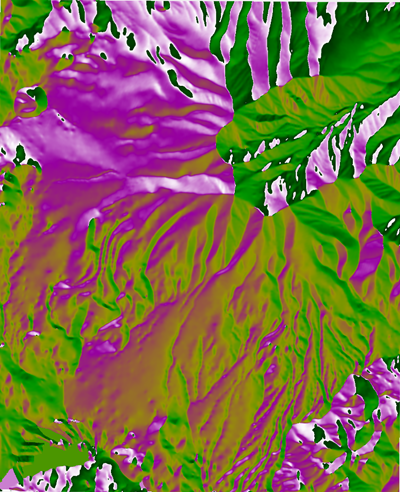
- Curvature (profile, plan, cross-sectional, minimal, longitudinal, maximum, mean)
- Feature extraction (pits, channels, passes, ridges, peaks, planar regions)

- Feature network extraction
- Residual at center
- Mean of residuals
- Shaded relief
- Frequency distribution

- Fractal dimension
- Statistical analysis

- Peak/pit classification

Some of these can be done faster by the Windows program MicroDEM, but LandSerf can sometimes offer more flexibility in selecting the display colors used to represent the parameters; other functions are unique to LandSerf.
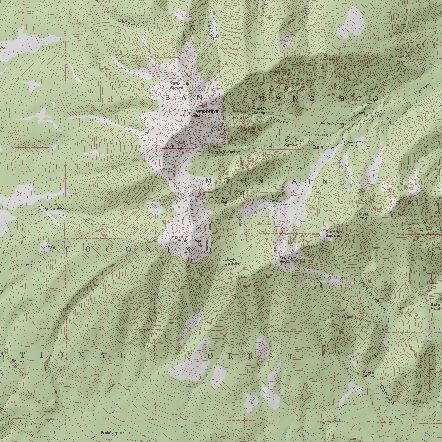
Also in common with MicroDEM, LandSerf also has functions to blend raster images, for instance a topo map blended with shaded relief:
And 3D visualization:
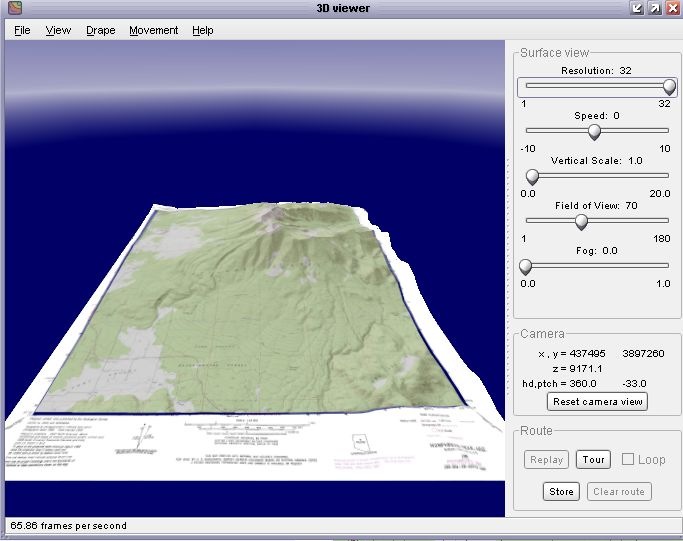
But for blending and 3D visualization, LandSerf falls far below MicroDEM in terms of speed, ease of use, flexibility, and quality of results.
Other LandSerf raster-related features:
- A built-in scripting language for automating raster processing, and to do raster map algebra
- A map rectification function for georeferencing, notable because it includes quadratic and cubic rectification; many free GIS programs include only linear rectification.
Re-reading this post, I see that it jumps around like crazy. I guess that’s sort of a reflection of LandSerf’s functionality, which also jumps around. I’m glad it’s available for the unique things it does, especially since it’s free, but it does have its share of quirks.
Coming up: A look at LandSerf’s vector data functions.