While most maps, paper or computer, are flat, the world isn’t. Map projections are mathematical methods for representing part or all of the quasi-spherical Earth (irregular oblate spheroid, to be more precise) on a flat surface. The book Flattening the Earth: Two Thousand Years of Map Projections, covers the history and many of the hundreds of projections devised to “flatten the earth”. And I’ve covered a few map projection viewers on this blog before.
Just as a map projection viewer alone, Flex Projector (Java; versions for Windows, Linux and Mac) would be worth a look. It has over 25 pre-defined map projections that you display (along with listed values for their areal/scale/angular errors), and includes the ability to display two projections at once for comparison purposes (here, Plate Carree in black vs. Mercator in gray):

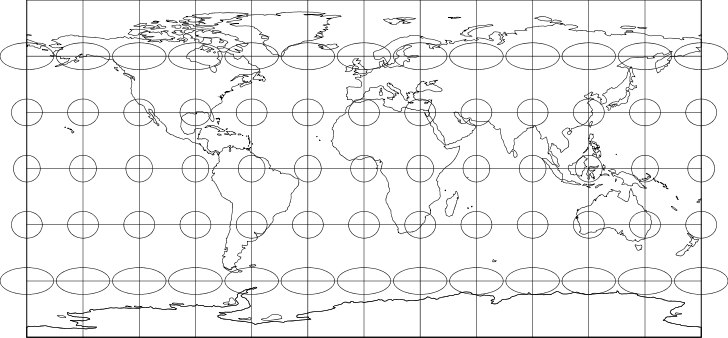
You can overlay Tissot’s indicatrices on the map to show distortion created by the projection:

Export the entire map display, or just the coastlines/graticule/Tissot’s indicatrices in image or vector formats:
- Illustrator
- DXF
- Shapefile
- JPG
- PNG
In addition to the built-in data, you can download more detailed vector data, either from the website or directly from the program itself. You can also import shapefiles, raster images (assumed to be the world in Plate Carree; there are downloadable samples on the website), and ESRI ASCII Grid files, then re-project them in the selected projection and export them (Cylindrical equal area here):

For some reason, I find this projection especially enlightening – it reminds me of how big Africa really is.
But what really sets Flex Projector apart is the ability to create your own projections, using a pre-defined one as your starting point. Among the factors you can change are:
- Length of parallels
- Distance of parallels from the equator
- Bending of parallels
- Distance between meridians
- Longitude of the center line
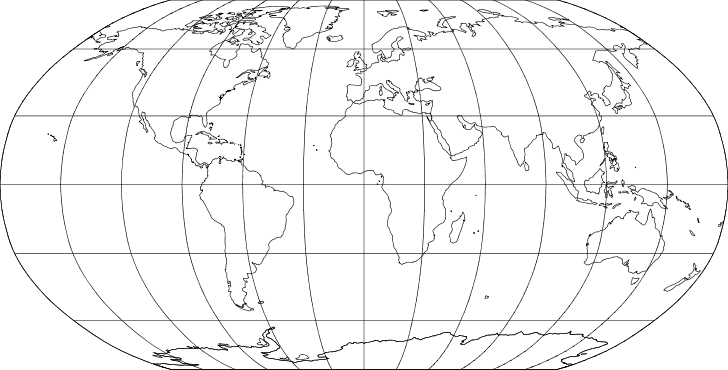
For example, starting with the Robinson projection:

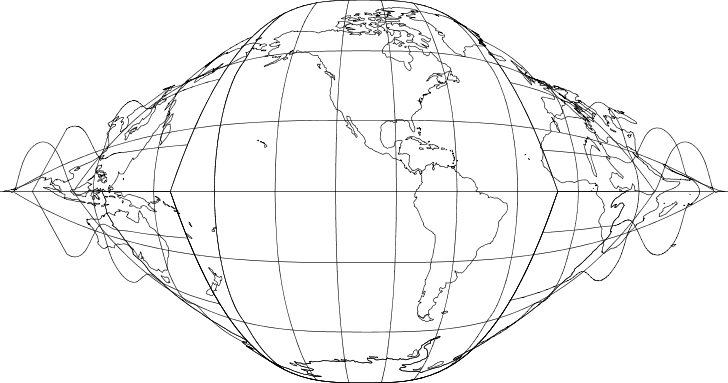
I modified some of the parameters to create a new projection that I’m calling the “American” projection:

Useful? No. Accurate? No. Practical? No. But that’s never stopped America before ….
Once defined, you can save them for loading in another time; you can also export a distortion table with distortion parameters for your projection (labeled “Flex” in the table) along with those for the pre-defined projections.
Flex Projector is a great cartography exploration and learning tool; highly recommended.