Johann Blake writes about his new tool to plot geographic Google Analytics data in Google Earth or Google Maps. Just follow the instructions on the website to export the Analytics data in XML format to your computer, then upload the file to the site. You have the choice of creating either a straight KML file for Google Earth, or a direct plot of the data in Google Maps; the latter doesn’t seem to work currently in Firefox 3, but does work in Internet Explorer. You get placemarks for every country from which you had a visitor, color/type coded by the total number of visitors:
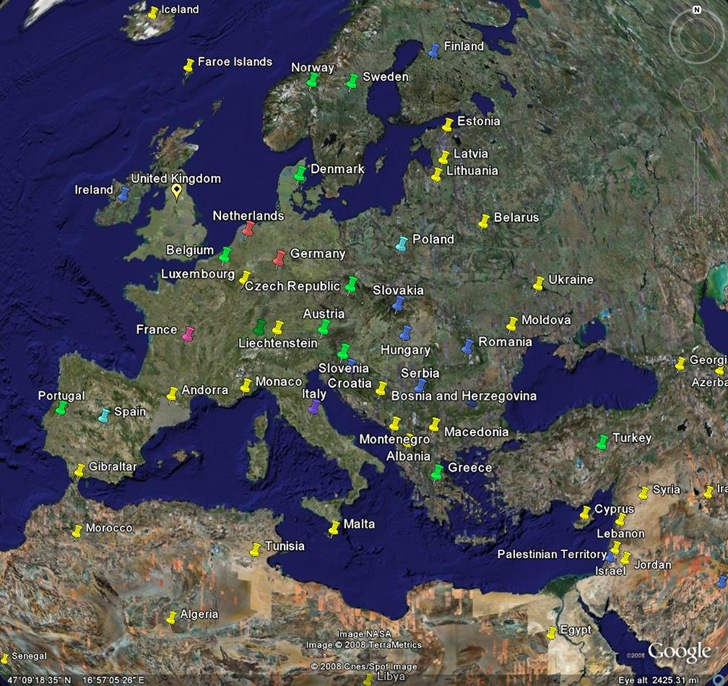
Click on a placemark in either Google Earth or Google Maps to see the number of visitors from that country. You can use the standard Google Analytics controls to select the desired time frame, and also filter data.
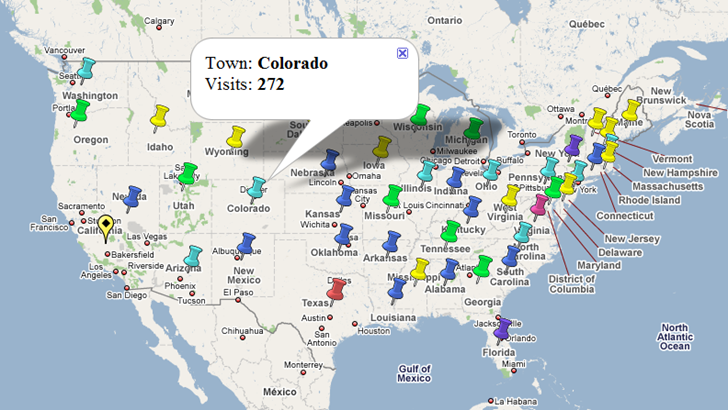
It appears as though you can also select geographic sub-regions in Google Analytics like the US states below. I did get a bunch of error messages in Google Maps, and the District Of Columbia plotted in the South Atlantic, before the rest of the states plotted correctly:
This older tool was able to plot individual visitors, but required a raw data export capability that Google Analytics no longer provides. So for now, Johann’s site is the best available GE/GM Analytics tool.
1 Response to “Plot Google Analytics Geographic Data In Google Earth/Maps”