PolicyMap is a new site that offers access to “over 4,000 indicators related to demographics, real estate, crime, health, schools, housing affordability, employment, energy, and public investments”, and lets you display them in map, tabular and graphical formats. While some datasets require a paid subscription, many are available for free. Datasets include:
- Real Estate Analysis
- Neighborhood Conditions
- Crime
- Mortgage Originations
- Education
- Money & Income
- Demographics
- Owners & Renters
- Jobs
- Energy
- Federal Housing
- Environment
- Schools
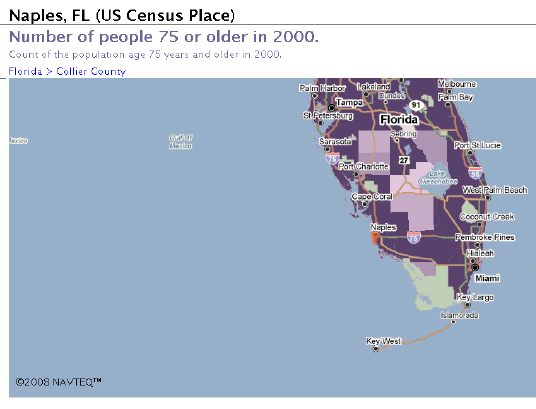
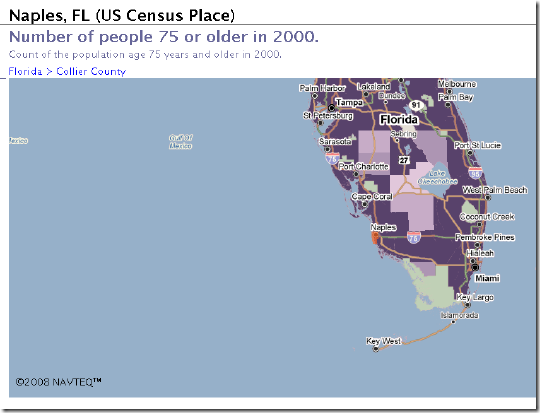
Below is a sample map showing elderly population in southern Florida:
Maps can be exported in JPG or PDF format. Subscription buys access to more datasets, and the ability to upload your own data.