If you were wondering how I created the Google Earth rainfall plot in yesterday’s post on FAO climate data, I didn’t use one of the shapefile to KML converters I’ve posted about. Instead, I used a free program called GE-Graph that takes tabular data and lets you plot it in colors and polygons that depend on the value you’re plotting.
You can enter data directly in GE-Graph using its table editor, including pasting columns from a spreadsheet, but it will also accept CSV-format text data createable in a spreadsheet in the proper format:Name, latitude, longitude, value to be plotted (data only, no column headers).
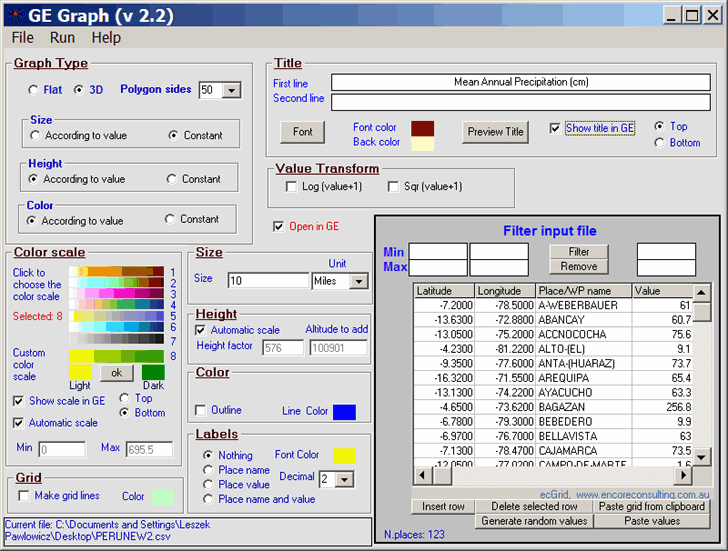
Open the data in GE-Graph (click on image for larger view):

Here you can set:
Graph of Type: Flat (pinned to the ground, with colors describing the data value) or 3D (Polygons, with the number of sides set by the dropdown). You can also link data to a custom KML polygon file (e.g. state borders), and use those as the plotted shapes.
Height (3D only): Whether the height varies with the data value or not
Color: Whether the color of the polygon or flat area varies with the data value; colors set using the Color Scale section
Size: The size of the flat area or polygon as plotted in Google Earth
… and so on – you can set the specific scales for the data, or have GE-Graph do that automatically, enter labels, specify a grid, etc.. There’s a full help section included with the program.
Here’s the plot from yesterday’s post, created with the above settings and data, as displayed in Google Earth:

More examples of the kinds of plots that GE-Graph can create, along with the download link, are available at the GE-Graph website.
Looks like a fantastic visualisation tool :)
It seems very nice utility but it doesnt work with Windows Vista Business addition. When i run it tells me,
“Failed to load control Ã?©cGrid’from ecGrid.ocx. Your version of ecGrid.ocx may be outdated. Make sure you are using teh version of the control that was provided with your application”.
Any help please??