LIDAR (Light Detection and Ranging) can be used to create high-resolution terrain data (sub-meter), detail good enough to show individual man-made features like buildings and bridges. It’s especially useful for analyzing terrain in areas that are in constant change, like coastlines. High-resolution coastal LIDAR data is available at this NOAA website for the entire US ocean coastline, and parts of the Great Lakes coastlines, for times ranging from 1996 to the present.
Data can be downloaded in a number of formats:
- XYZ points
- Contour shapefile
- Contour DXF file
- GeoTiff format (graphic image, not DEM)
- ASCII gridfile
Here’s a sample of 1-meter-resolution data for an area of the North Carolina Outer Banks (click on the image for a larger view):

If you own ArcView or ArcMap with Spatial Analyst, NOAA offers a free extension for manipulating the data. But if you don’t have those programs, MicroDEM offers some useful tools for analyzing LIDAR coastal data.
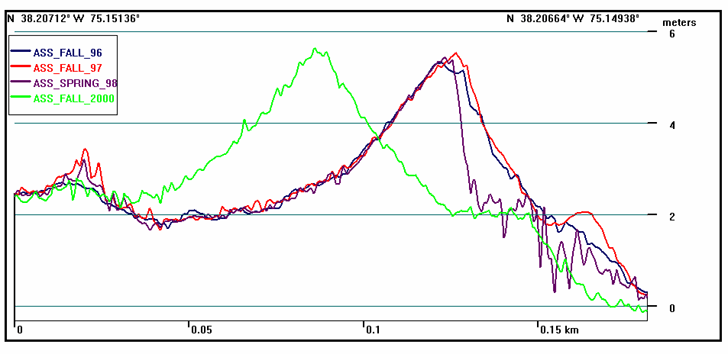
MicroDEM has the ability to compare multiple LIDAR terrain profiles from different times, e.g. for analysis of beach erosion over time (graph taken from the MicroDEM helpfile):

Consult the helpfile (search for LIDAR) for a full explanation of how to create such a graph. You’ll also need to download the original data in UTM to get the horizontal distance axis units correct in the graph.
You can also use this LIDAR data to create extremely-high-resolution animations of coastal flooding. At his MicroDEM website, Professor Peter Guth, the author of MicroDEM, has posted an animated GIF showing a 1-meter LIDAR DEM of the downtown Annapolis area (the program also lets you generate AVI and MPG animations as well), along with the effects of a 2-meter rise in sea level due to a storm surge like that from Hurricane Isabel. The procedure for creating such an animation is described in a previous post. The DEM resolution is so good, in fact, that man-made objects like bridges might be seen by MicroDEM as obstacles to flooding even though they’re not, and the resulting flooding animation wouldn’t be fully accurate. Dr. Guth has just modified MicroDEM to allow you to specify multiple starting points for flooding to compensate for artificial, unreal obstacles like bridges, overpasses, or even the edge of the downloaded DEM. You’ll need to download the most recent release of the MicroDEM executable, and copy it to the program directory.
You could use such a high-resolution DEM to created an animated view in Google Earth, but the resolution would be wasted, since Google Earth positions can easily be off from the true position by as much as 10 meters. But this could be a useful tool for disaster planning using topo maps of the same area.
Thank you for the information.
Nice post.
Covered the points as general.