blankblank blank


Author Archive for Leszek Pawlowicz Page 53 of 79


ILWIS GIS Is Now Open Source

ILWIS (the Integrated Land and Water Information System), a GIS software package from the International Institute for Geo-Information Science and Earth Observation in the Netherlands, has moved from paid (100 euros) proprietary status to free open source status as of today. Its key features (listed by the original website) include:

  • Integrated raster and vector design
  • Import and export of widely used data formats
  • On-screen and tablet digitizing
  • Comprehensive set of image processing tools
  • Orthophoto, image georeferencing, transformation and mosaicking
  • Advanced modeling and spatial data analysis
  • 3D visualization with interactive editing for optimal view findings
  • Rich projection and coordinate system library
  • Geo-statistical analysis, with Kriging for improved interpolation
  • Production and visualization of stereo image pairs
  • Spatial Multiple Criteria Evaluation

But that only begins to describe its capabilities.

Supervision and support of ILWIS development has been handed over to the 52 North Organization, and as of today, they have an ILWIS page up with download links and installation directions. 52North also has a download page for the 500+ page user’s guide for ILWIS, along with sample data for the demos in the user’s guide. However, 52 North doesn’t have the 700+ page Reference Guide or the Applications Guide With Data up yet on their site, and there’s no indication whether they will be posted there in the future. These additional documents are still up on the original website, and definitely worth getting. While they mainly reference version 2.1, most of the information is still valid for the final 3.3 version converted to open source.

The Applications Guide in particular contains descriptions of how to use the software in specific applications, along with the actual data used in the example applications. To give you a feeling for ILWIS’s capabilities, among the 27 chapters in the Application Guide are:

  • Modelling erosion from pyroclastic flow deposits on Mount
    Pinatubo
  • Seismic landslide hazard zonation
  • Assessing aquifer vulnerability to pollution in the Piana Campana
  • Remote sensing and GIS techniques applied to geological survey
  • Tools for map analysis applied to the selection of a waste
    disposal site
  • Analysis of urban change and spatial pattern
  • Cibodas: analyzing the fuelwood demand

I’ll have more posts on ILWIS’s capabilities in the near future.


Sea Level Rise Google Mapplet

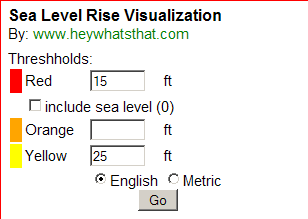
From the people who brought you Hey, What’s That? and two Google Mapplets for adding contour lines and terrain profiling to Google Maps comes the Sea Level Rise Visualization mapplet, more advanced than the Flood Maps website mentioned in a previous post. You can set three different flooding levels, and assign different colors to them (red, orange, and yellow):

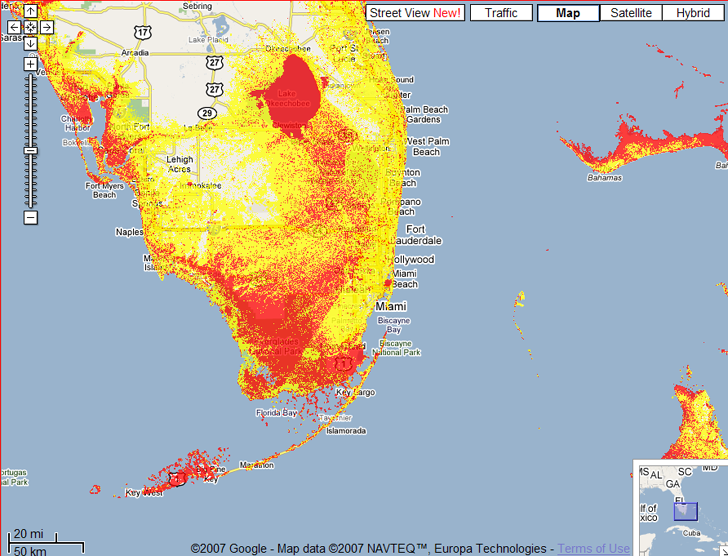
sea level rise in south Florida

For those diehards out there, you can choose English units (feet) instead of meters, and modify the flooding level numbers and update the map quickly by clicking on the “Go” button. Leaving a level blank omits that color from the map. Here’s an image from south Florida that uses the numbers above:

sealevelrisemap

As the mapplet and my earlier post on Flood Maps point out, there are limitations to this approach deriving from the data. The SRTM data used for this has a spatial resolution of 90 meters, so the results will have a comparable spatial resolution. And SRTM data includes the heights of building and vegetation in the terrain, so urban areas like Miami will have SRTM terrain heights that are higher than the true terrain level, and the flooding level there will be undermapped by this mapplet. You’ll need to use higher resolution data with building/vegetation effects for more accurate results, as is done in this post. But for a quick estimate, this Mapplet does a nice job.Two additional tips on Google Mapplets:

– Google Mapplets aren’t currently accessible from the main Google Maps page; use this Preview link to reach a Google Maps page with an Mapplets tab

– You can reach any Mapplet by creating a single link like this one:http://maps.google.com/ig/add?moduleurl=http://www.heywhatsthat.com/mapplets/sealevel.xml&pid=mpl&synd=mpl; to test it out, just click on the link, and you’ll be given the option of adding this mapplet to Google Maps MyMaps. To create a direct link to any other Mapplet, just replace the text “www.heywhatsthat.com/mapplets/sealevel.xml” with the address of the Mapplet you want to reach. Thanks to Mike Kosowsky of HeyWhatsThat.com for this tip.


Two Google Mapplets From The "Hey What's That" Site

As a followup to yesterday’s post on the updates at “Hey What’s That”, I was going to post today about a pair of Google Mapplets created by Michael Kosowsky that allowed you to lay contour profiles on any Google Map, and also create terrain profiles. But Ogle Earth beat me to it; no use re-inventing the wheel. One minor correction: the preferred addresses for the mapplets are:

http://www.heywhatsthat.com/mapplets/contours.xml

and

http://www.heywhatsthat.com/mapplets/profiler.xml


An Advanced Alternative To Google Street View

Webware posts advance info about Earthmine, a street-view urban imagery system similar to Google Street View, but with some advanced features. Earthmine uses still photography instead of video, so the image quality is supposedly higher than that of Google Street View. More interestingly, they’re combining the image data with laser range finding to both correct perspective views and provide location data for the objects in the photos. Privacy concerns will be addressed by automatic blurring of features like faces and license plates. The mapping service will be sold commercially, but a consumer-friendly portal will supposedly launch later this summer. Other street view services linked to in the article are Microsoft’s Live Search Maps , EveryScape, and HopStop .

Addendum: According to Download Squad, you’ll also be able to tag and label objects in the view.


Gallery Of Google Maps Mapplets

If you visit the Google Maps Developer Preview page, and click on the “Browse Content” button or “Add Content” link, it will take you to a multi-page listing of dozens of currently-available Mapplets; keep clicking on the “more” link at the upper right to take you to the next page. Click on an “Add it to Maps” button below an Mapplet, and it will be added to your Mapplets bookmarks.


News About "Hey What's That" Panorama And Viewshed Site

Michael Kosowsky, one of the creators of the “Hey What’s That” site (for panoramas, viewsheds and peak identification in Google Maps and Google Earth) has sent out an email with some news:

  • He gave a talk at Google about his website in early May, which you can view at Google Video
  • Contour mapping at Hey What’s That, which was spotty before, is now improved; contours should be visible at every zoom level.


Creating A Network KML Link To A Google Spreadsheet

So I saw the article on the Google Earth Blog about the new Google Earth Outreach program, and was reading the tutorial page when I noticed that there’s now the capability to create a network KML link from a Google Spreadsheet to Google Earth. When did they do that?!

There’s been the ability to create a network link from the EditGrid online spreadsheet site for a while now, developed in part by Valery Hronusov. The new Google capability seems like it has more options and flexibility in terms of displaying information, but it’s still not exactly pushbutton simple, either – you’ll have to follow the directions quite carefully. And of course you’ll also need a Google account to do this as well. Visit the tutorial page, click on the link for the starter spreadsheet, and follow the instructions step-by-step either on the tutorial page itself or on the instruction page that shows up at the starter spreadsheet.

It’s probably best to first make a working copy of the starter spreadsheet using the File=> Copy command before doing anything else. Click on the links at the bottom to access the Template, where you can specify the file information, icon and colors to be used for the placemarks and info balloon. Click on the Placemarks link at the bottom of the spreadsheet page to enter the actual data you want to plot in Google Earth. For location, you can enter latitude/longitude directly, or enter an address and have Google geocode it for you automatically (you can cut and paste this data from another spreadsheet). Then follow the convoluted tutorial directions for creating first a network link to this spreadsheet data, then adding the network link to Google Earth. I have to believe they’ll come up with an easier way, eventually, but this will do for now for a network-linked spreadsheet.

For a static spreadsheet file, there are other options for creating a plain KML file that might make more sense; take a look in this website’s “spreadsheet category” for any number of ways to do that, like this link:

Importing Spreadsheet Data Into Google Earth

or this link:

Another Excel To KML Converter


GIS-Oriented Linux Distributions

Frank over at VerySpatial.com wants to know where the GIS-oriented Linux distributions are. Well, here are three four:

GIS-Knoppix: A GIS-oriented version of the bootable Knoppix Linux distribution, but can be installed on your computer as well. Has GRASS, OpenJump, qGIS, MapServer, Thuban, and a bunch more.

Host-GIS: A Linux distribution designed around MapServer; comes with example installations and data.

Archeos: An archaeology-oriented Linux distribution, but with lots of GIS applications as well (GRASS, MapServer, OpenJump, SAGA, etc.). But good luck downloading a copy of this – not only is it over 1 GB in size (a DVD ISO file), but if my browser doesn’t crash when I try to download it, I get a 404 error page.\

Arch Linux (AEGIS): Mentioned in the comments; GRASS, JUMP, qGIS, MapServer and a bunch more.

I install a copy of Linux on my computer every few years, then take it off – doesn’t offer enough value for the time it takes to install, configure and learn it. I may give Wubi a try, since it seems to simplify the installation process for Ubuntu in Windows, and I’m waiting to see what happens with LINA, a project to make Linux software runnable on Windows and Macintosh with a native OS look-and-feel.