On his excellent Thematic Mapping blog (now part of my blog roll), Bjorn Sandvik has been running a series on thematic mapping techniques in Google Earth. Examples have included choropleth maps, bar charts, prism charts, Collada objects, map legends, including examples of animated time series. If you’re into the techy part of this stuff, the series is well worth a look for the ideas you’ll get from it, and the downloadable example files. But for non-techy types, the prospect of learning how to do this might have been a bit intimidating. Heck, I find it intimidating, and I know at least a litlle about this stuff.
But Bjorn has taken his examples to the next level, by creating an online tool that can convert datasets to thematic Google Earth maps on the fly, the Thematic Mapping Engine:
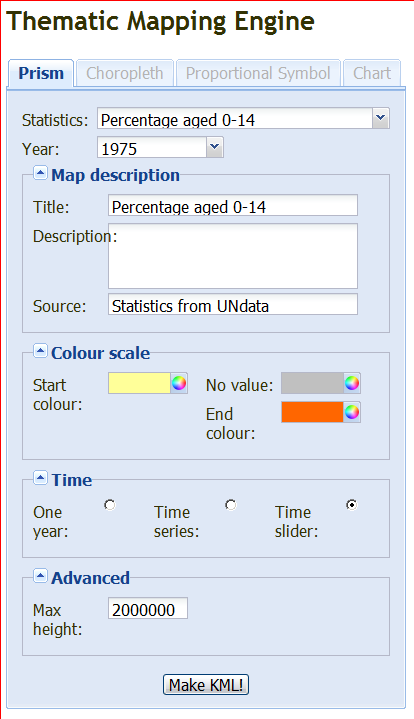
Only Prism maps are supported in this initial release, with other types (Choropleth, Proportional Symbol and Chart) coming in the future. You’re also currently limited in the datasets to 15 worldwide datasets from the UN, but the ability to import your own data is also coming. You can select data for one year, for a time series, or create a time map with a slider that lets you view the chart in animated format as the years roll by. The “colour” scale sets the endpoint colors for the chart, and these colors will be used to generate a legend for the chart. Click on Make KML, and you can download the KMZ file to your computer / open it in Google Earth directly:
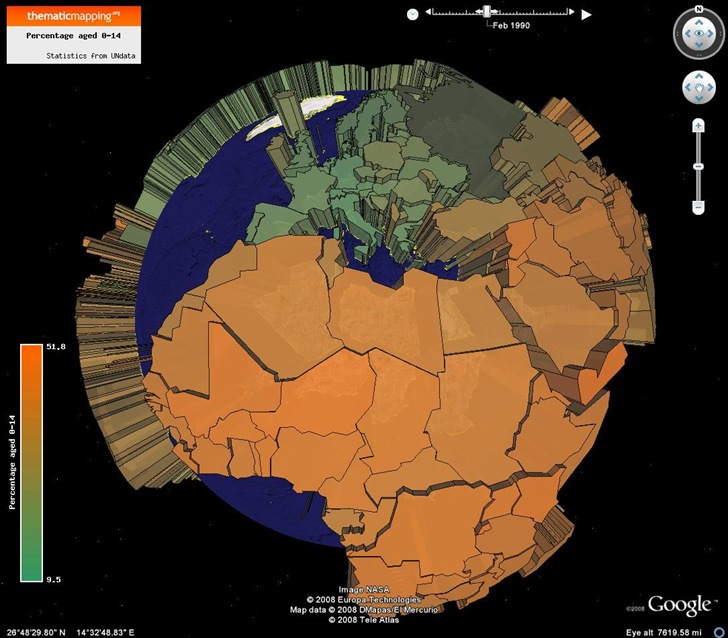
In Google Earth, use the slider at the upper right to change the data year, or click on the play button to see it animated.
I did find one minor quirk, but it’s likely a Google Earth bug. On my system, the first time I load one of these Thematic Mapping Engine KMZ files into Google Earth, I often see something like this:
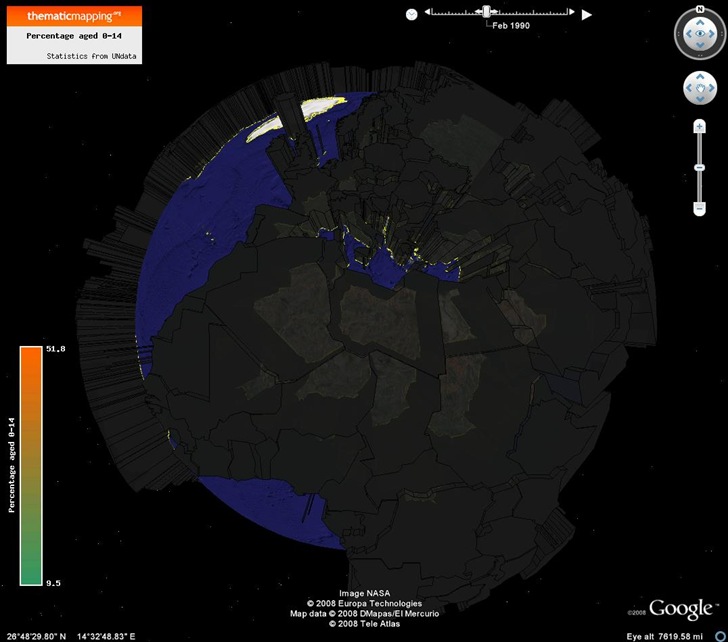
By turning the “sun” on (the View => Sun menu), and then turning the sun back off again, I get the correct view (i.e. the first picture). Resizing the Google Earth view can also create this effect, but the solution is the same.
Hi,
Thanks for a nice review of the Thematic Mapping Engine. I believe the black prisms is cased by a bug in Google Earth. The new “Sun-feature” seems to cause problems to many types of overlays. Good that you found a solution to the problem.
Bjorn