In addition to displaying elevation directly, either as terrain or colors, MicroDEM can also display elevation derivatives. Examples include curvature, relief, summits and ridges, but the simplest are probably slope and aspect.
With a DEM loaded into MicroDEM, like this one:
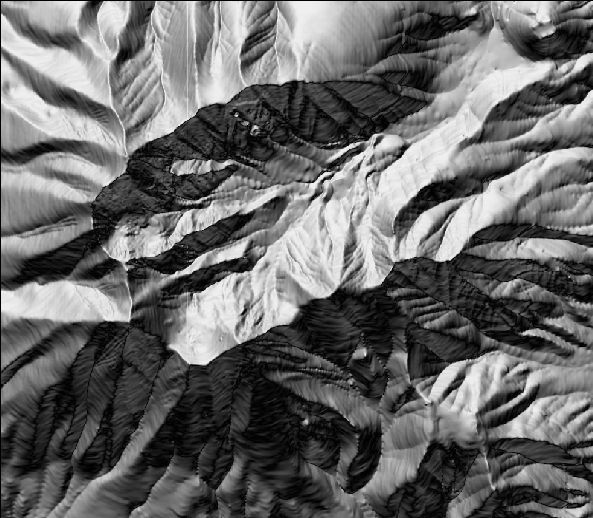
right-click on the display, and choose “Display parameters”, then “Slope”. The following window will come up:
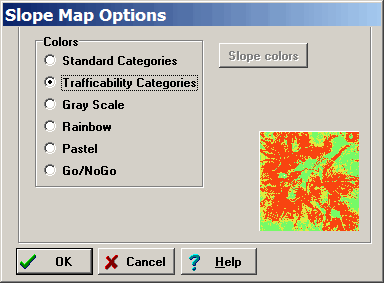
Here, you can select the coloring scheme to display slopes, with a preview in the lower right-hand corner. Only “Standard Categories” allows you to specify which colors go with which slope range; selecting that activates the “Slope colors” button:
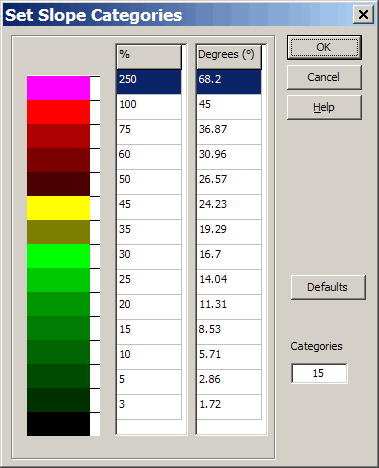
This is the default set of colors, which can be modified by double-clicking on them, and the default set of slope ranges (percent and degree), which can be modified by entering a different number; you can also modify the total number of colors displayed, up to a maximum of 15. Using these default settings, the DEM displayed above now looks like this:
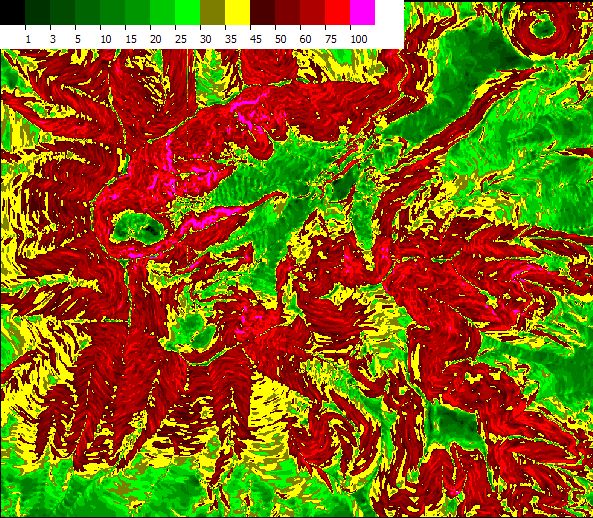
with the scale at the top showing the slope in percent (100% = 45 degree slope). Other “Slope colors” settings will produce different plots.
There are slope parameters that can be calculated for individual points or lines on the DEM. From the Calculate menu, select Slopes, then one of the following:
- Slope: Double-click on two points on the DEM, and get the average slope between the two.
- Point slope algorithm: Double-click on a point, and get a listing of the slopes as calculated by different algorithms
- Excessive slopes: Enter a percentage slope, and every point on the DEM with a slope greater than that percentage will be plotted. Click on the Redraw map button to get rid of them.
- Steepest slope: Finds the point on the DEM with the steepest slope.
- Directional: Double-click on a point, and find the slope in every direction.
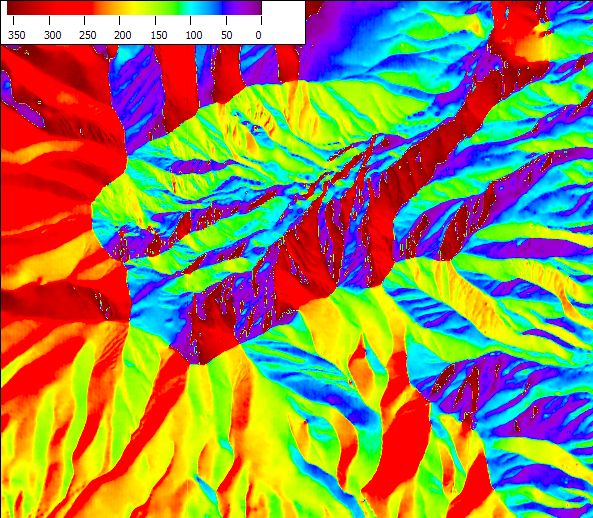
In addition to slope magnitude, there’s also the aspect, i.e. which direction the slope is facing. MicroDEM can do this as well; right-click on the map, select “Display parameters” then Aspect, and get the following:
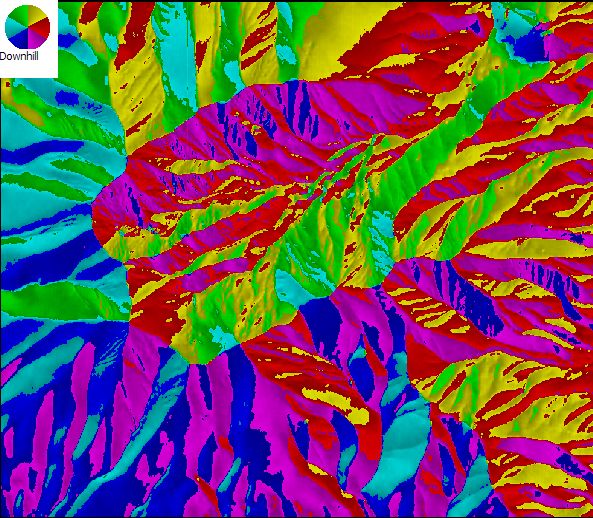
The key at the top tells you which color corresponds to which direction the slope is facing; you can’t modify the Peter-Maxian color scheme, though (if you’re under 40, Google Peter Max).
Additional derivative plots are available under the Calculate => Derivative menu. Included there are also alternate ways to plot both slope (e.g. by slope degree instead of by percent):
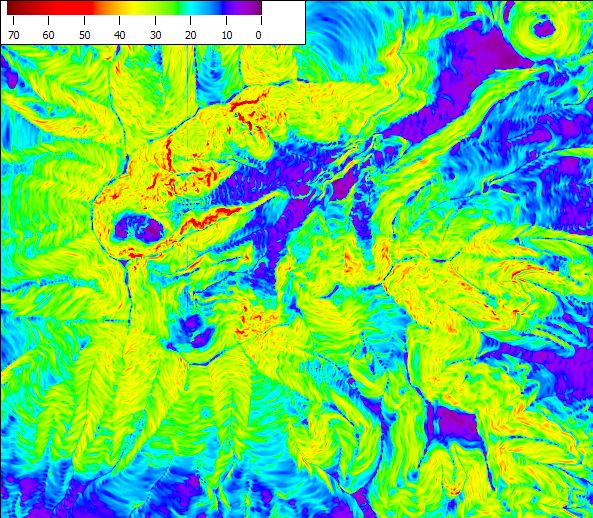
And aspect by a continuous color range over 360 degrees of compass direction:
