In addition to its primary terrain analysis functions, MicroDEM also has a number of map projection viewing features, accessible by opening a vector map from the File => Open => Vector Map menu, or clicking on the “Open vector map” button on the top toolbar:
![]()
This brings up the “Map Projections” window:
18 projections are available, not as many as G.Projector or Map Projections, but enough to cover the basic types. You can open multiple map projection views simultaneously by checking the “Open multiple maps” box, and then selecting multiple maps. For example, checking both the “Ellipsoidal Mercator” and “Cylindrical equal area” projections brings up these two maps:
The coordinate displays of the two maps are linked, so that moving the mouse cursor across one map displays a crosshair cursor at the corresponding position on the other map, useful for seeing how how distances and angles differ between two different projections. Because the maps are drawn using vector data, you can also enlarge them to a greater pixel resolution without losing too much detail by clicking on the “Zoom in” button:

and then save them at the higher resolution (for publication or presentation?) in PNG, JPG, GIF or BMP format using the “Save image” button:
![]()
Right-click on a vector map and choose “Modify projection” to change the projection or its parameters:
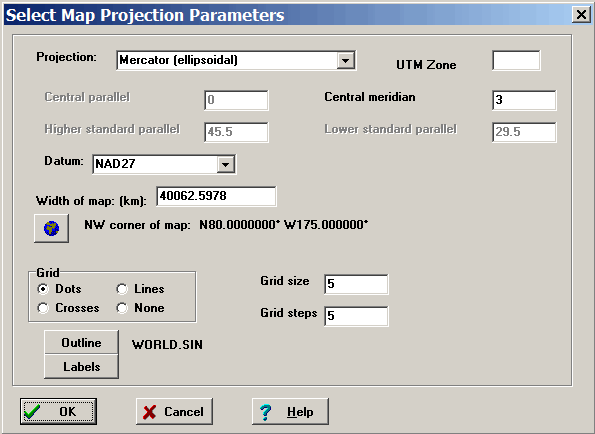
Here you can set the projection/datum with dropdowns, and change the viewing location and size of the map. Click on a radio button to change the latitude/longitude grid display from the default “Dots” to crosses, lines or none at all.
By checking the box marked “Tissot Indicatrix” in the original “Map projections” window up at the top, and setting the Tissot radius, you can plot Tissot’s indicatrix, like this example on an equidistant cylindrical (aka Plate Carree) projection:
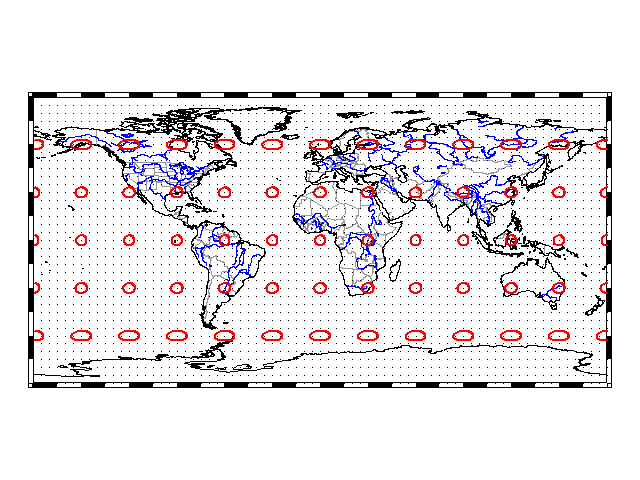
Move your cursor over the map, and in the status bar at the bottom will be displayed the scale factor along the meridian (h), scale along the parallel (k), and maximum angular distortion. Double-click on any point on the map, and a Tissot Indicatrix will be drawn there, labeled with the h and k for that point.
If you’ve displayed a vector map without the Tissot’s Indicatrix box checked, and want to plot them, select Cartography => Map distortion to plot a single Indicatrix with a double-click on the map, or select Cartography => Tissot Indicatrix to plot multiple indicatrices across the map.