Note: shp2kml seems to be currently unavailable; try AFFMapper as an alternative.
Two earlier posts talked about free, quick and simple ways to export shapefile data to Google Earth’s KML format. Both had limitations on how much of the shapefile’s attribute data could be imported into the KML file, and how the shapefile data could be displayed, especially polygon shapefiles. There are two programs I know of that allow you to export shapefile data to KML format with multiple attributes, and also modify the colors with which the shapefile data is plotted based on attribute data. One program is completely free, but has quirks and limitations; the other is not free but cheap, and is more flexible and capable. Today’s post looks at the free one.
shp2kml uses a step-by-step wizard approach to converting shapefiles into KML files. Start up the program:
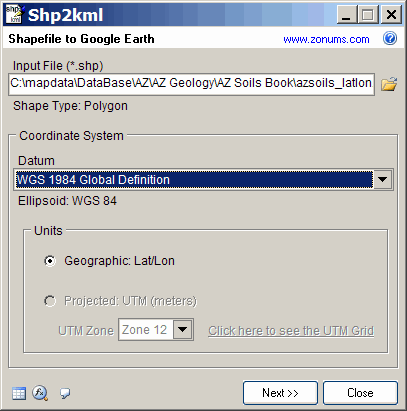
Here you select the shapefile you wish to export into KML format. You should also specify the shapefile’s native datum and coordinate system here; while a large number of datums are available, the only compatible coordinate systems are geographic and UTM. The product KML file will have coordinates in Google Earth’s native system, geographic/WGS84.
The three buttons in lower left let you look at the full shapefile attribute table, look at statistics for any attribute, and the third button … doesn’t seem to do anything at all, though it’s labeled “About”. These buttons are available from every wizard screen. Click on Next:
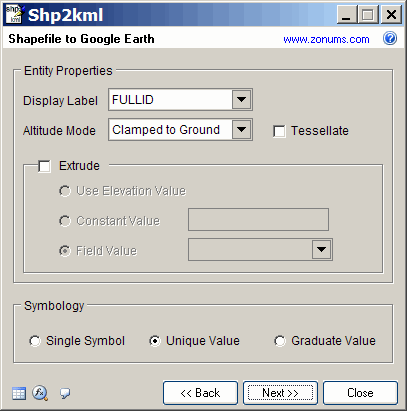
First select which shapefile attribute to use for the display label; this is the name the shape will have in Google Earth’s “Places” pane on the left. For altitude mode, only Clamped to Ground seems to work (“Tesselate” means to make things fit together, couldn’t figure out what this does).
The Extrude option makes shapes rise above Google Earth depending on an elevation field in the attribute table, a constant value , or a different attribute value. I had problems making this work; YMMV.
Symbology has three options:
- Single symbol – Same color for all plotted shapes
- Unique value – A unique color chosen based on a particular attribute value
- Graduate value – Color based on numerical value of attribute. For example, you could plot the color of a US state depending on its population, and grade the color from white to full red depending on how large the population of each state is (i.e. make a population chloropleth map).
Next:
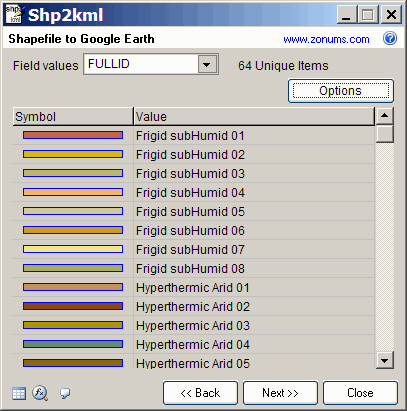
If you chose unique or graduated before, you’ll be able to modify the color scheme here. You select the field you want to color by using the “Field values” drop-down”. The window above shows when “Unique” is selected in the previous step, and shp2kml populates every unique field value with a color automatically. If you want to change a particular color, just double-click on it to change it. The “Options” button lets you set opacity, outline width and color, filled or not filled, outlined or not outlined for all field values. You can also set these individually for every field value by double-clicking on the color.
If you chose “Graduate value” in the previous step, you get a slightly different screen:
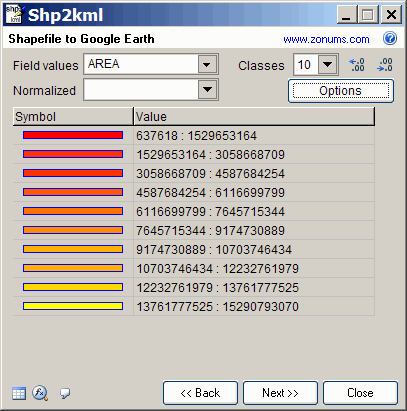
Set the numerical field value to use for graduated value; you can normalize this with another field using the box below. For example, you could normalize population by area to get population density. The Classes dropdown sets the number of color divisions; the buttons to the right of Classes increase and decrease number of decimal places. You can change the colors for specific ranges by double-clicking on them, but for a graduated display, you’d do better to choose “Color Ramps” from the “Options” menu, and set the desired colors corresponding to low and high field values. When done, click on Next:
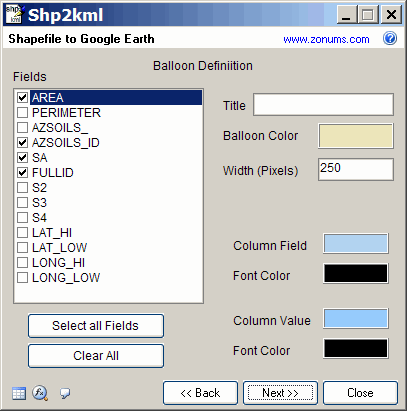
Here you can choose which shapefile attributes will get displayed in a balloon that pops up when you click on the feature name in the Google Earth Places pane. You can also set color, fonts, title, and balloon size here as well. Next:
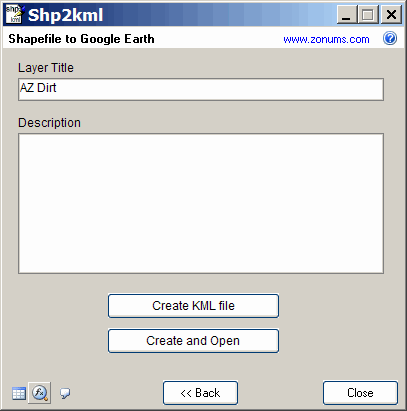
Here, you set the title to be displayed in the Google Earth Places pane, and an optional description. Now you can either create and save the KML file, or create it and open it automatically in Google Earth.
Here’s an example of shp2kml output, showing soil types in Arizona:

Generally, shp2kml works well, but it has a few quirks and drawbacks:
- It sometimes has problems with large or poorly-formatted shapefiles, and opening the resulting KML file in Google Earth may result in a “parsing error”.
- As noted earlier, I had problems with altitude and extruded displays.
- There’s not a lot of flexibility in converting files. For example, you can’t sort the resulting KML file listing by a shapefile attribute like name.
- You won’t see whether your color choices work well together until the KML file is opened in Google Earth.
- It can’t label the shapes in the Google Earth display, nor create a polygon centroid with pop-up information.
- And there’s no help file available yet.
Still, for the price ($0), shp2kml is a pretty good deal. But if it doesn’t do everything you need, there’s a cheap program that works in conjunction with a free GIS program to offer great flexibility and power in converting shapefiles to Google Earth format; that’s the topic of an upcoming post.
Manejo de informacion geografica
gracias