Back in 2005, EarthPlot software released several shareware tools for plotting data and creating graphic overlays in Google Earth. The most recent versions of their software are now available as freeware. If you’re interested in plotting spreadsheet data or creating annotated overlays in Google Earth, you should definitely check these out.
More after the fold …
Continue reading ‘EarthPlot Software Tools For Google Earth’
So I saw the article on the Google Earth Blog about the new Google Earth Outreach program, and was reading the tutorial page when I noticed that there’s now the capability to create a network KML link from a Google Spreadsheet to Google Earth. When did they do that?!
There’s been the ability to create a network link from the EditGrid online spreadsheet site for a while now, developed in part by Valery Hronusov. The new Google capability seems like it has more options and flexibility in terms of displaying information, but it’s still not exactly pushbutton simple, either – you’ll have to follow the directions quite carefully. And of course you’ll also need a Google account to do this as well. Visit the tutorial page, click on the link for the starter spreadsheet, and follow the instructions step-by-step either on the tutorial page itself or on the instruction page that shows up at the starter spreadsheet.
It’s probably best to first make a working copy of the starter spreadsheet using the File=> Copy command before doing anything else. Click on the links at the bottom to access the Template, where you can specify the file information, icon and colors to be used for the placemarks and info balloon. Click on the Placemarks link at the bottom of the spreadsheet page to enter the actual data you want to plot in Google Earth. For location, you can enter latitude/longitude directly, or enter an address and have Google geocode it for you automatically (you can cut and paste this data from another spreadsheet). Then follow the convoluted tutorial directions for creating first a network link to this spreadsheet data, then adding the network link to Google Earth. I have to believe they’ll come up with an easier way, eventually, but this will do for now for a network-linked spreadsheet.
For a static spreadsheet file, there are other options for creating a plain KML file that might make more sense; take a look in this website’s “spreadsheet category” for any number of ways to do that, like this link:
or this link:
From the abstract at the Geographically based Economic data (G-Econ) website:
“The G-Econ data set calculates gross value added at a 1-degree longitude by 1-degree latitude resolution at a global scale for all terrestrial cells. These data allow better integration of economic and environmental data to investigate environmental economics, the impact of global warming, and the role of geophysical factors in economic activity. On of the major results is to show that the true economic deserts of the globe are in Greenland, Antarctica, northern Canada, Alaska, and Siberia.”
Downloadable spreadsheet data includes not just economic data, but also environmental data:
- Precipitation (monthly)
- Temperature (monthly)
– Terrain
- Elevation
- Roughness
- Standard deviation of elevation
– Vegetation
– Soil Types
Convert the spreadsheet data to shapefile format, or plot it directly in Google Earth using GE-Graph.
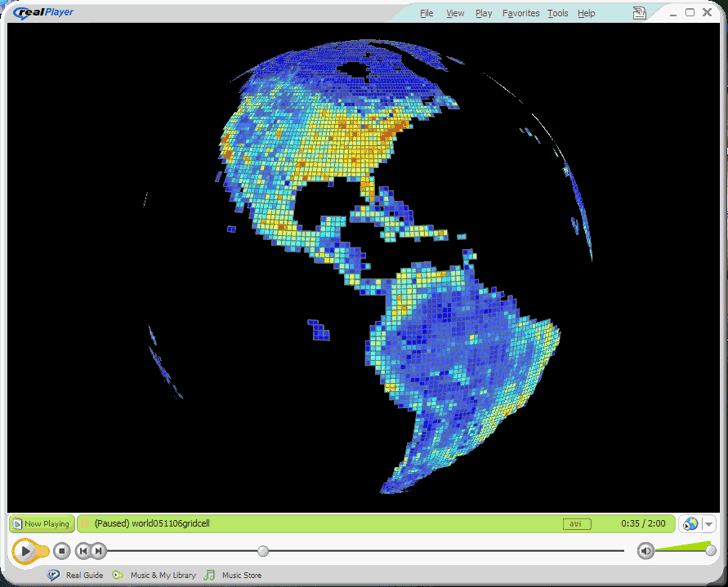
The site also has rotating globe animations with data plotted:

Via Vector One.
Two previous posts talked about the coordinate converters CorpsCon and GeoTrans. Both are very good, but are large in filesize, and not necessarily user-friendly. There are two other freeware coordinate converters that are smaller in download size (1.7 MB and 0.9 MB), and fairly easy to use for single point conversions.
Continue reading ‘Coordinate Converters III – Two Freeware Converters’
Converting point text files to shapefiles is easy; converting sets of text coordinates describing lines and polygons, not so much. I’ve found a way to convert sets of text vertex coordinates into line and polygon shapefiles, but there are some limitations:
- The sets of vertex coordinate points need to be in the right order, i.e. all the points describing a line or a polygon need to be listed in the order they define a shape.
- You can only create a single line or single polygon at a time; if you have multiple shapes described by sets of points, you’ll have to generate the shapes one at a time and then merge all the shapefiles later on.
- No attribute data gets converted – you’ll have to enter it manually for every shape in the final product file. Fun.
The basic process is straightforward:
1. Create a CSV file with the vertex coordinates for the individual shapes. The first row should contain field names for the coordinates (e.g. Lat, Long), separated by commas. This is probably most easily done in a spreadsheet program.
2. Change the file suffix from CSV to TXT.
3. Open the file in DNRGarmin (File => Load From => File, with “Text File” as the file type).
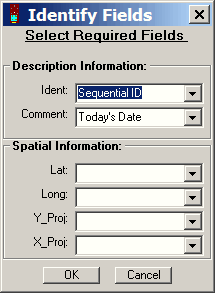
4. Specify the field names that correspond to the spatial information, and click OK.

5. Select “Track” or “Route” from the radio buttons above the data table.
6. Choose File => Save To => File; enter a filename, and select “Arc View Shapefile” as the file type.
7. In the pop-up window that shows up after you click OK, specify whether you want the point data to be converted to a line shapefile or a polygon shapefile. Click on OK, and the points will be converted to the specified shapefile type.
A post from a few days ago describes a somewhat convoluted multi-step process for converting shapefiles to text/spreadsheet format. Zonums Software has let me know that a new version of his free Shape2Text utility is available which simplifies the process tremendously.
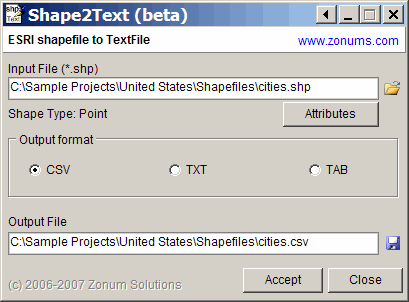
Download the Shape2Text zipfile, and unzip it and the supporting .bpl files into its own directory (no install program). Run the program, and select the shapefile you want to convert to a text format:

For point shapefiles, an Attributes button will become active; click on it, and you can select which of the shapefile attributes will be exported along with the coordinates. You can delimit the file with commas (CSV), spaces (TXT) or tabs (TAB). An output file name and location will be auto-generated, but you can change that as well. Click on Accept, and the text file will be created. A lot easier than the earlier method!
The program also exports line and area shapefile vertices, but without attribute data, there’s no separation of data from individual shapes in the shapefiles, and there’s some additional data in the header section that you may need to edit out.
Addendum: The program requires Borland .bpl files, which should come included in the zip file. If you get an error message indicating that .bpl file is missing, you can download the needed file from this site. Copy it to the program directory, or put it in your Windows/System32 folder for access by any program in the future that might need it.
Yesterday’s post dealt with converting point shapefiles to a text format compatible with spreadsheets. Today’s post handles the opposite – converting spreadsheet data to point shapefile format.
Continue reading ‘Converting Text/Spreadsheet Files To Point Shapefile Format’
It’s sometimes useful to convert the location data in shapefiles to a text format, for viewing and manipulation in spreadsheets or other programs. You’re likely to want to include the associated data from the attribute table as well. Haven’t found a single-step solution for this, but there’s a fairly simple two-step process that works well for point shapefiles; lines and areas are somewhat more problematical.
Continue reading ‘Converting Point Shapefiles To Text/Spreadsheet Format’


